 Sign-up for free online course on ANSYS simulations!
Unable to render {include} The included page could not be found.
Under Construction
This page is under construction. Please return later for updates
Results
Open the Post Processor
In the Project Schematic double click Results to open the post processor. When the A6: Fluid Flow (FLUENT) - CFD - Post Window opens, look at the geometry by clicking the +Z axis on the compass

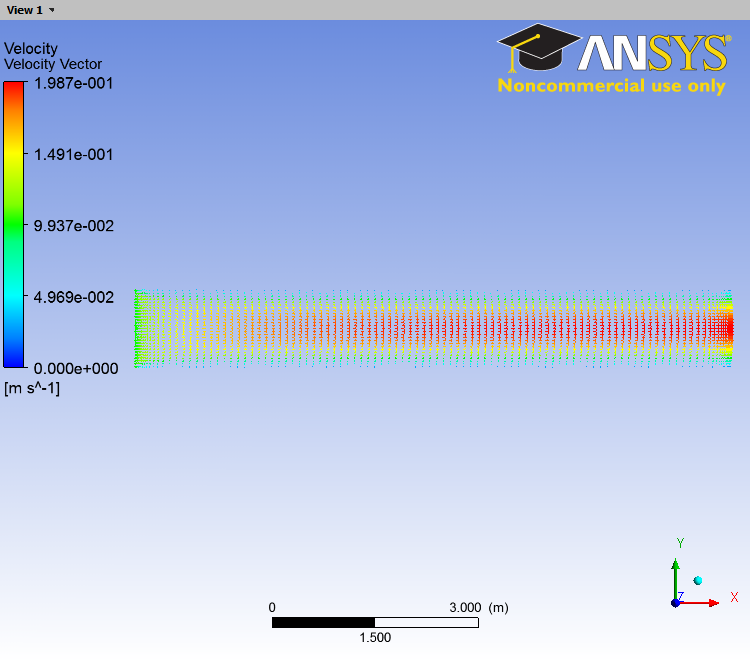
Velocity Vectors
In the Post Processing window, click the Vector icon  to create a vector result. When prompted, name the result
 Velocity Vector. In the Details of Velocity Vector window, begin on the Geometry tab. Under Locations, select Periodic 1. This will show the velocity along the entire geometry surface periodically. Next, click on the Symbol tab. Change the Symbol Size to 0.1. Finally, move to the View tab. We want to see the entire geometry of the pipe: not just half of it like we currently see. To see the whole pipe, check the box next to Apply Reflection/Mirroring, and change the Method to ZX Plane. Because the pipe is long and skinny, it will be difficult to see the results. This post processor allows us to stretch the results to make the results easier to see. To apply a scaling, check the box next to Apply Scale, and change the Scale to 1,10,1 (this will scale the y-direction by 10). When finished, press Apply to see the result. If you wish to see the result without the wireframe of the pipe, uncheck the box next to Wireframe under User Location and Plots.

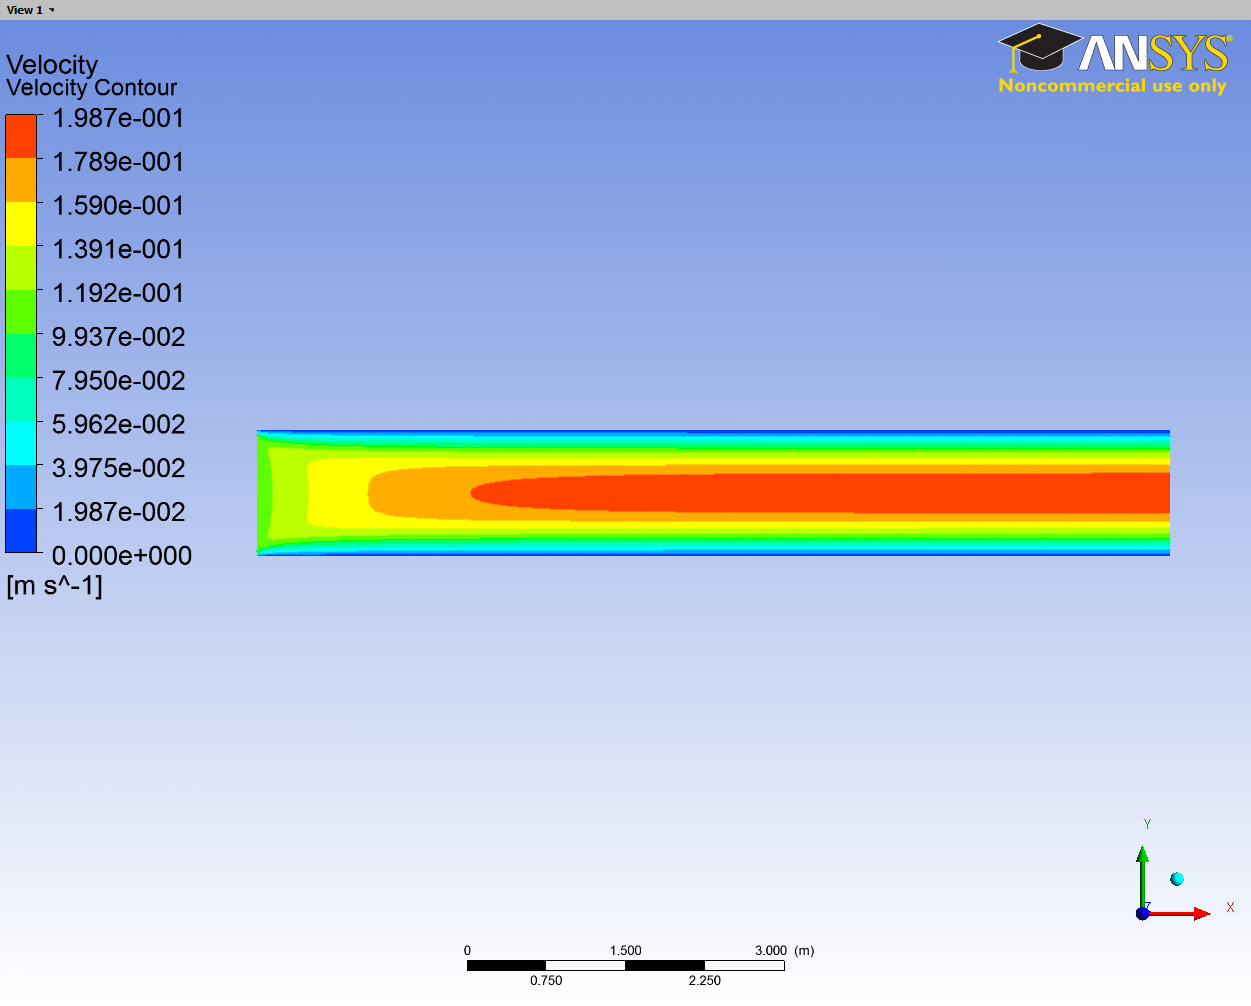
Velocity Contour
In the Post Processing window, click the Contour icon  to create a Contour result. When prompted, name the result
 Velocity Contour. In the Details of Velocity Contour window, begin on the Geometry tab. Under Locations, again select Periodic 1. Also, change the Variable to Velocity. Next, move to the View tab. Check the box next to Apply Reflection/Mirroring, and change the Method to ZX Plane and again,check the box next to Apply Scale, and change the Scale to 1,10,1. When finished, press Apply to see the result. Finally, we need to remove the Velocity Vectors from the Graphic Window. Do this by unchecking the box next to Velocity Vector in the Outline window under User Location and Plots.

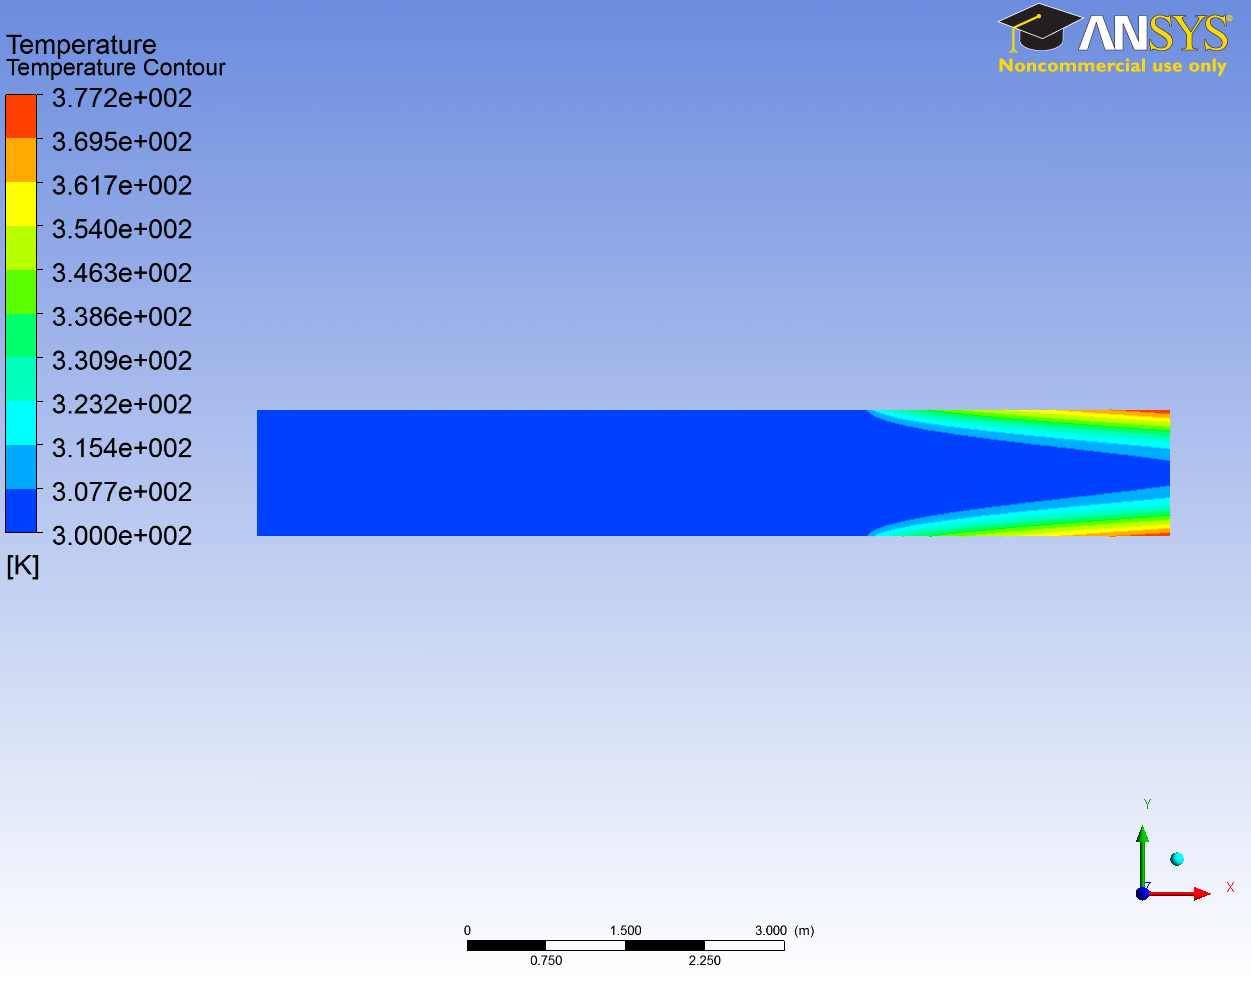
Temperature Contour
In the Post Processing window, click the Contour icon to create another Contour result. When prompted, name the result Temperature Contour. In the Details of Temperature Contour window, begin on the Geometry tab. Under Locations, select Periodic 1. This time, change the Variable to Temperature. Next, move to the View tab. Apply the same mirroring and scaling as we did for the Velocity Contours. When finished, press Apply. Uncheck the box next to Velocity Contour to only see the Temperature Contours.

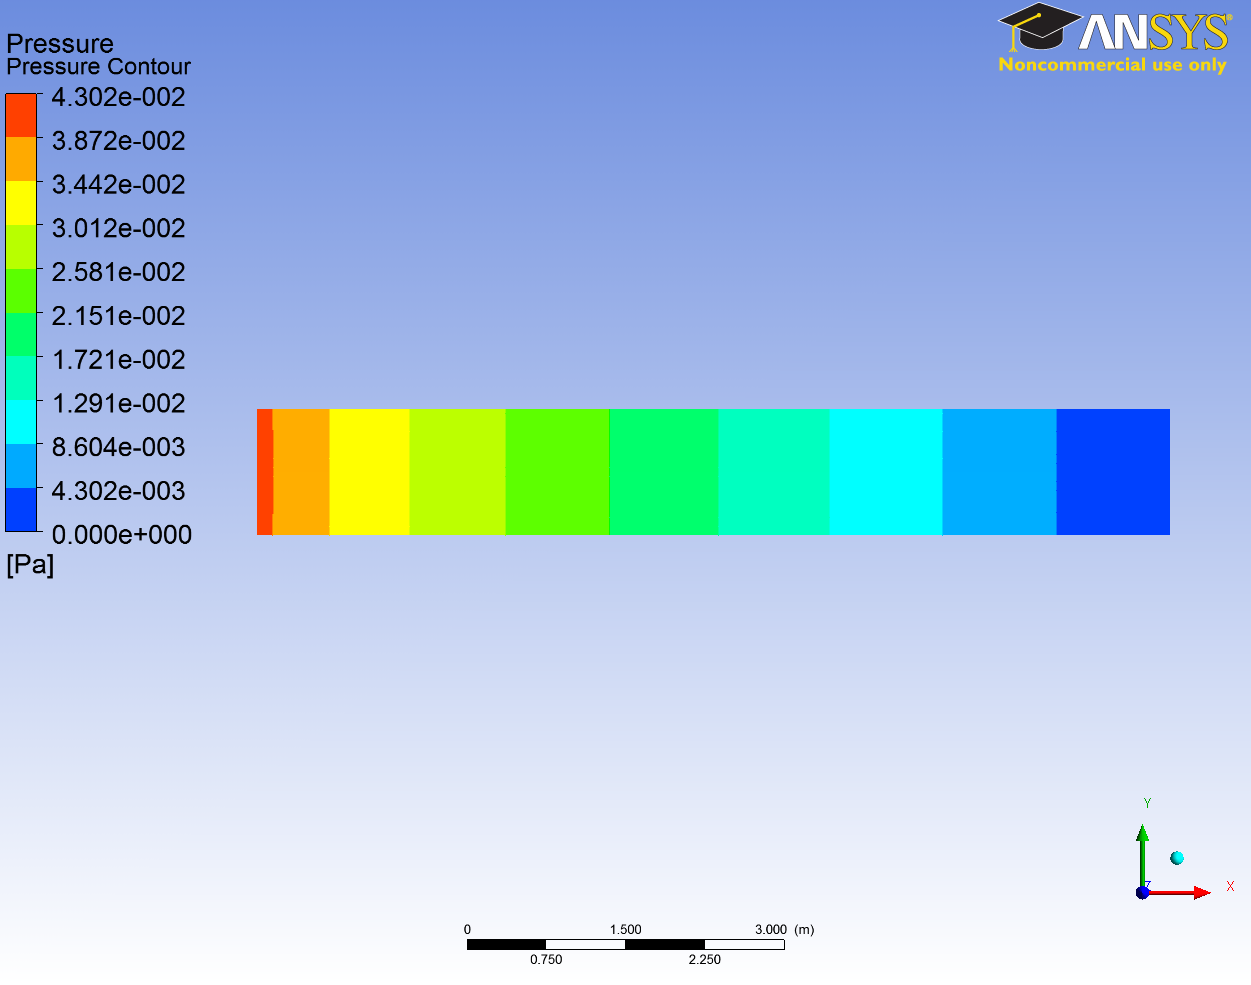
Pressure Contour
Create another contour result, and name Pressure Contour. Use all of the same settings as the previous results but this time choosing Variable > Pressure in the Geometry tab.

Graph of Temperature along Centerline
To graph the temperature along the centerline, we first need to create the centerline as a path. To accomplish this, click on the Location icon  , select Line, and name the line
 Centerline. In the Details of Centerline window, set the Method to two points. Point 1 is (0,0,0), and Point 2 is (8.64,0,0). Enter these values into the details window. Next, change the number of Samples to 100. Press Apply once finished.

To create a chart, press the chart icon in the menu bar. When prompted, name the page Temperature Along Centerline. In the Details of Temperature Along Centerline window, begin on the General tab. In the Title, enter Temperature Along Centerline. Next, click on the Data Series tab. Under Data Source, in the drop down menu next to Location, select Centerline. Now move to the X Axis tab. In the drop down menu next to Variable, scroll all the way down and select X. In the Y Axis tab, change the Variable to Temperature. when finished, press Apply to see the chart.