 Sign-up for free online course on ANSYS simulations!
...
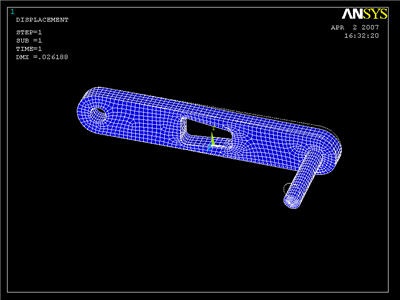
This plots the deformed and undeformed shapes in the Graphics window. The maximum deformation DMX is .026188in as reported in the Graphics window. We should check that our results make sense. It appears that the boundary counditions have been satisfied as the tip of the shaft moves downward and the other end of the crank is undeformed.
Animate the deformation
Utility Menu > PlotCtrls > Animate > Deformed Shape...
...
To see the whole model again, go to the Select Entities window and click Sele All and Replot. (If for some reason select all fails, you can always go to Utility Menu > Select > Everything)
Comparing the Sigma_xx Stress with von Mises Stress
...
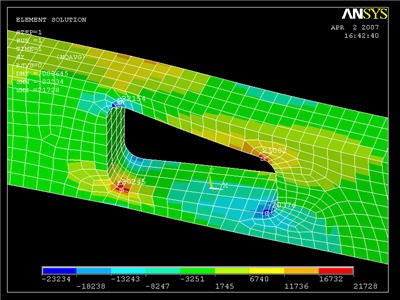
Select Stress, X-direction SX, and click OK. The picking window will appear, and you can click on any point in the model. Click OK when finished.
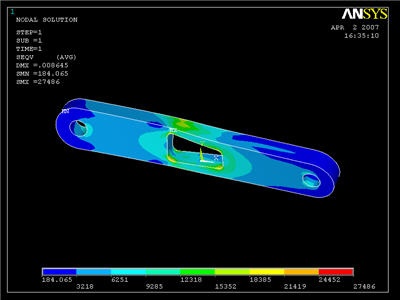
Compare the stress values with the von Mises stress. (Click on von Mises stress, then OK)
...
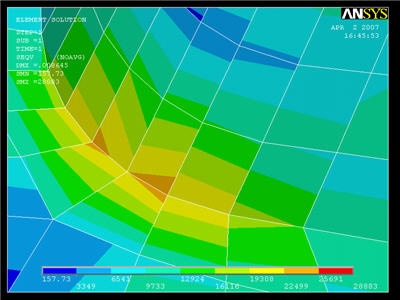
Click on Stress, then von Mises Stress, then the OKbutton. The stress in adjacent elements appears to be fairly continuous, suggesting that we have selected a good mesh for this area. We will check this in the next step when we refine the mesh.
Go to Step 9: Validate the results