 Sign-up for free online course on ANSYS simulations!
...
In a perfect world, we would be able to validate the ANSYS results by comparing them with strain gage measurements at selected locations. We unfortunately don't have strain gage measurements for this particular geometry but will anyway show you the process by which you can calculate the average strain over an area where a strain gage would be placed. This will help prepare you to compare your ANSYS results with strain gage measurements for a diffrent different geometry for which you may have experimental data.
Let's assume that the strain gage is placed on the front face of the crank (z=0.5") roughly halfway between the left hole and the cutout as shown below.
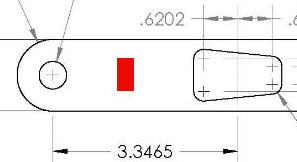
In the coordinate system in our model, let's say this area is given by -1.77"≤ x≤ -1.57" and 0.45"≤ x≤ y≤ 0.85". To find the average strain in this area, we will select all nodes that lie in this area and then list the strain values at these nodes. You can copy these values over to Excel or MATLAB to find the average value.
...
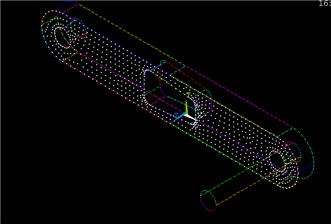
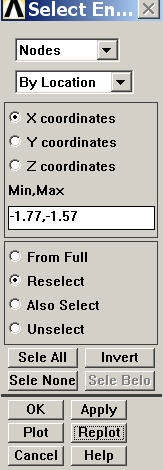
From these currently selected nodes, we next select nodes that satisfy the following criterion: -1.77"≤ x≤ -1.57". In the Select Entities menu, retain Nodes at the top. Select By Location and X coordinates below that. Enter Min,Max values as per the snapshot below. Since we want the nodes to be selected from the current set rather than the full set, choose the Reselect radio button. Click Apply and then Replot.
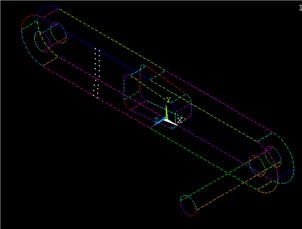
You should see that only the nodes that are in the desired x-coordinate range are selected.
...
Main Menu > General Postproc > List results > Nodal Solution > Elastic Strain > X-Component of Elastic Strainelastic strain
You can save these values to a text file using File > Save as. You can then read in the values from the text file into Excel or MATLAB for further processing such as finding the average.
...