 Sign-up for free online course on ANSYS simulations!
...
In the coordinate system in our model, let's say this area is given by -1.77"≤ x≤ -1.57" and 0.45"≤ x≤ 0.85". To find the average strain in this area, we will select all nodes that lie in this area and then list the strain values at these nodes. You can copy these values over to Excel or MATLAB to find the average value.
elp Let's zoom in on the red area. Use the mouse wheel to zoom in and out in the view area. Some other viewing functions: Holding down the Ctrl key and the left mouse button allows you to pan the view, while holding the Ctrl key and the
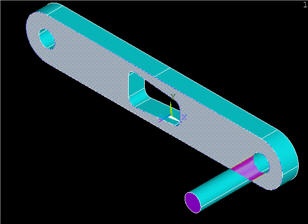
ANSYS provides extensive capabilities, referred to as "select logic", for selecting a subset of the full model using various criteria. We'll use select logic to select the nodes on the front face of the crank. We'll first select the area corresponding to this face.
Utility Menu > Plot > Areas
Utility Menu > Select > Entities
Select Areas from the pull-down menu at the top. Make sure By Num/Pick is selected below that. Click Apply.
Hold down the left mouse button until the front face is picked. Click OK in the pick menu.
Only the area corresponding to this face is selected currently. Verify this by clicking Replot in the Select Entities menu (this replots areas).
One key think to remember about ANSYS' "select logic" is that the various entity types (areas, volumes, nodes, elements, etc) are selected independently. So all nodes are still "selected", not just the ones that are located on the front face of the crank. Verify this: Utility Menu > Plot > Nodes.
So we now need to select the nodes attached to the selected area. In the Select Entities menu, select Nodes from the pull-down menu at the top and Attached to below that. Select Areas, All below that. Click Apply.
Check that only nodes attached to the front face are currently selected by clicking Replot in the Select Entities menu (this replots areas).
We can get a better idea of where these nodes are located by plotting nodes as well as lines.
Go to Step 9: Validate the results
...