 Sign-up for free online course on ANSYS simulations!
...
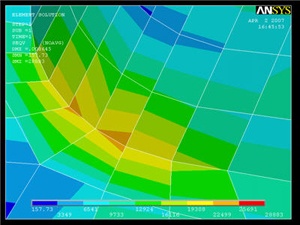
When you plot the "Nodal Solution", ANSYS obtains a continuous distribution as follows:
1. It determines the average at each node of the values of all elements connected to the node.
2. Within each element, it linearly interpolates the average nodal values obtained in the previous step.
This procedure is in effect a smoothing operation.
The stress concentration located at the tip of the shaft can be ignored as the force is applied as a point load. Let's look at the results just for the crank by deselecting the elements within the pedal shaft volume. Go to
...
Click on Stress, then X-Component of stress , then the Apply. Notice that the top-left and bottom-right corners of the cutout area are now blue, and that the scale has been readjusted to show that blue is now a large negative stress value. If this were a case of pure bending, we would expect the top of the crank to be in tension, not compression!
...
Recall that the nodal solution shows average smoothed stress values. Let's compare the nodal solution with the element, i.e. non-smoothed, solution.
General Postproc > Plot Results > Contour Plot > Element Solu
Click on Stress, then von Mises Stress, then the OK button. The stress in adjacent elements appears to be fairly continuous, suggesting that we have selected a good mesh for this area. We will check this in the next step when we refine the meshIn the vicinity of the cut-out corners, there are fairly significant discontinuities in the von Mises stress across adjacent elements. This suggests that we need to refine the mesh at least in this region. This is done in the next step.
Go to Step 9: Validate the results
...