 Sign-up for free online course on ANSYS simulations!
...
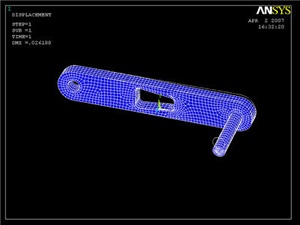
This plots the deformed and undeformed shapes in the Graphics window. The maximum deformation DMX is 0.026128 026128 inches as reported in the Graphics window. We should check that our results make sense. It appears that the boundary counditions conditions have been satisfied as the tip of the shaft moves downward and the hole at the other end of the crank is undeformedheld in place.
Animate the deformation
Utility Menu > PlotCtrls > Animate > Deformed Shape...
Select Def + undeformed and click OK. Select Forward Only in the Animation Controller. This is also a good way to check the boundary conditions have been applied correctly. Close the Animation Controller.
Plot Nodal Solution of von Mises Stress
...
For a quick refresher on von Mises stress, click Help. Search for von mises and click on the result 2.4 Combined Stresses and Strains. This can be useful if your MAE212 book isn't lying around.
Select Nodal Solution > Stress > von Mises stress and click OK. To change the range of stresses displayed, go to
...
When you plot the "Nodal Solution", ANSYS obtains a continuous distribution as follows:
1. It determines the average at each node of the values of all elements connected to the node.
2. Within each element, it linearly interpolates the average nodal value values obtained in the previous step.
The stress concentration located at the tip of the shaft can be ignored as the force is applied as a point load. To hide the crank shaft, go Let's look at the results just for the crank by deselecting the elements within the pedal shaft volume. Go to
Utility menu > Select > Entities ...
Select Volumes, By Num/Pick, From Full and click Apply. Pick the crank volume and click OK. After we've selected a volume, we must next select all the elements in this volume to be plotted. In the Select Entities window, select Elements, Attached to, Volumes and click Apply. Click Replot to display the new selection. Notice the deformation is exaggerated, revealing that deformation is primarily caused by torsion.

To see select the whole model again, go to the Select Entities window and click Sele All and Replot. If for some reason select all fails, you can always go to Utility Menu > Select > Everything.
Comparing Comparing the σxx Stress with von Mises Stress
...
Click on Stress, then X-Component of stress , then the Apply. Notice that the top-left and bottom-right corners of the cutout area are now blue, and that the scale has been readjusted to show that blue is now a large negative stress value. If this were a case of pure bending, we would expect the top of the crank to be in tension, not compression!
...
If grey areas are appearing in your contour plots, you should go to Utility Menu > PlotCtrls > Style > Contours > Uniform Contours ..., select Auto calculated, and click OK.
To find out information about specific points on the model, go to
...