 Sign-up for free online course on ANSYS simulations!
...
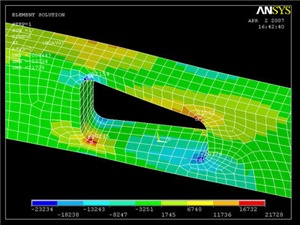
Click on Stress, then X-Component of stress , then the Apply. Notice that the top-left and bottom-right corners of the cutout area are now blue, and that the scale has been readjusted to show that blue is now a large negative stress value. If this were a case of pure bending, we would expect the top of the crank to be in tension, not compression! (Note: if grey areas are appearing in your contour plots, you should go to Utility Menu > PlotCtrls > Style > Contours > Uniform Contours ..., select Auto calculated, and click OK.)
To find out information about specific points on the model, go to
General Postproc > Query Results > Subgrid Solu
Select Stress, X-direction SX, and click OK. The picking window will appear, and you can click on any point in the model. Click OK when finished.
Compare the stress values with the von Mises stress. (Click on von Mises stress, then OK)
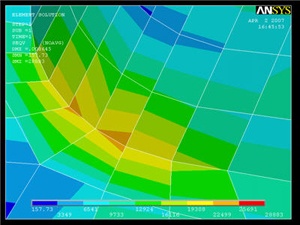
Investigate the Stress Concentration
...
Recall that the nodal solution shows average stress values. Let's compare the nodal solution with the element solution.
General Postproc > Plot Results > Contour Plot > Element Solu
Click on Stress, then von Mises Stress, then the OKbutton OK button. The stress in adjacent elements appears to be fairly continuous, suggesting that we have selected a good mesh for this area. We will check this in the next step when we refine the mesh.
Go to Step 9: Validate the results
See and rate the complete Learning Module
...