| Name | Size | Creator | Creation Date | Labels | Comment | ||
|---|---|---|---|---|---|---|---|
| File Dissolved atmospheric gases.xmcd | 181 kB | user-9c36d | May 13, 2009 10:28 |
|
|||
| Version 1 (current) | 181 kB | user-9c36d | May 13, 2009 10:28 | ||||
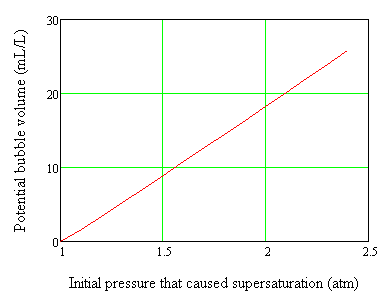
| PNG File Bubble Formation Potential.png | 2 kB | user-9c36d | May 13, 2009 10:27 |
|
|||
| Version 1 (current) | 2 kB | user-9c36d | May 13, 2009 10:27 | ||||
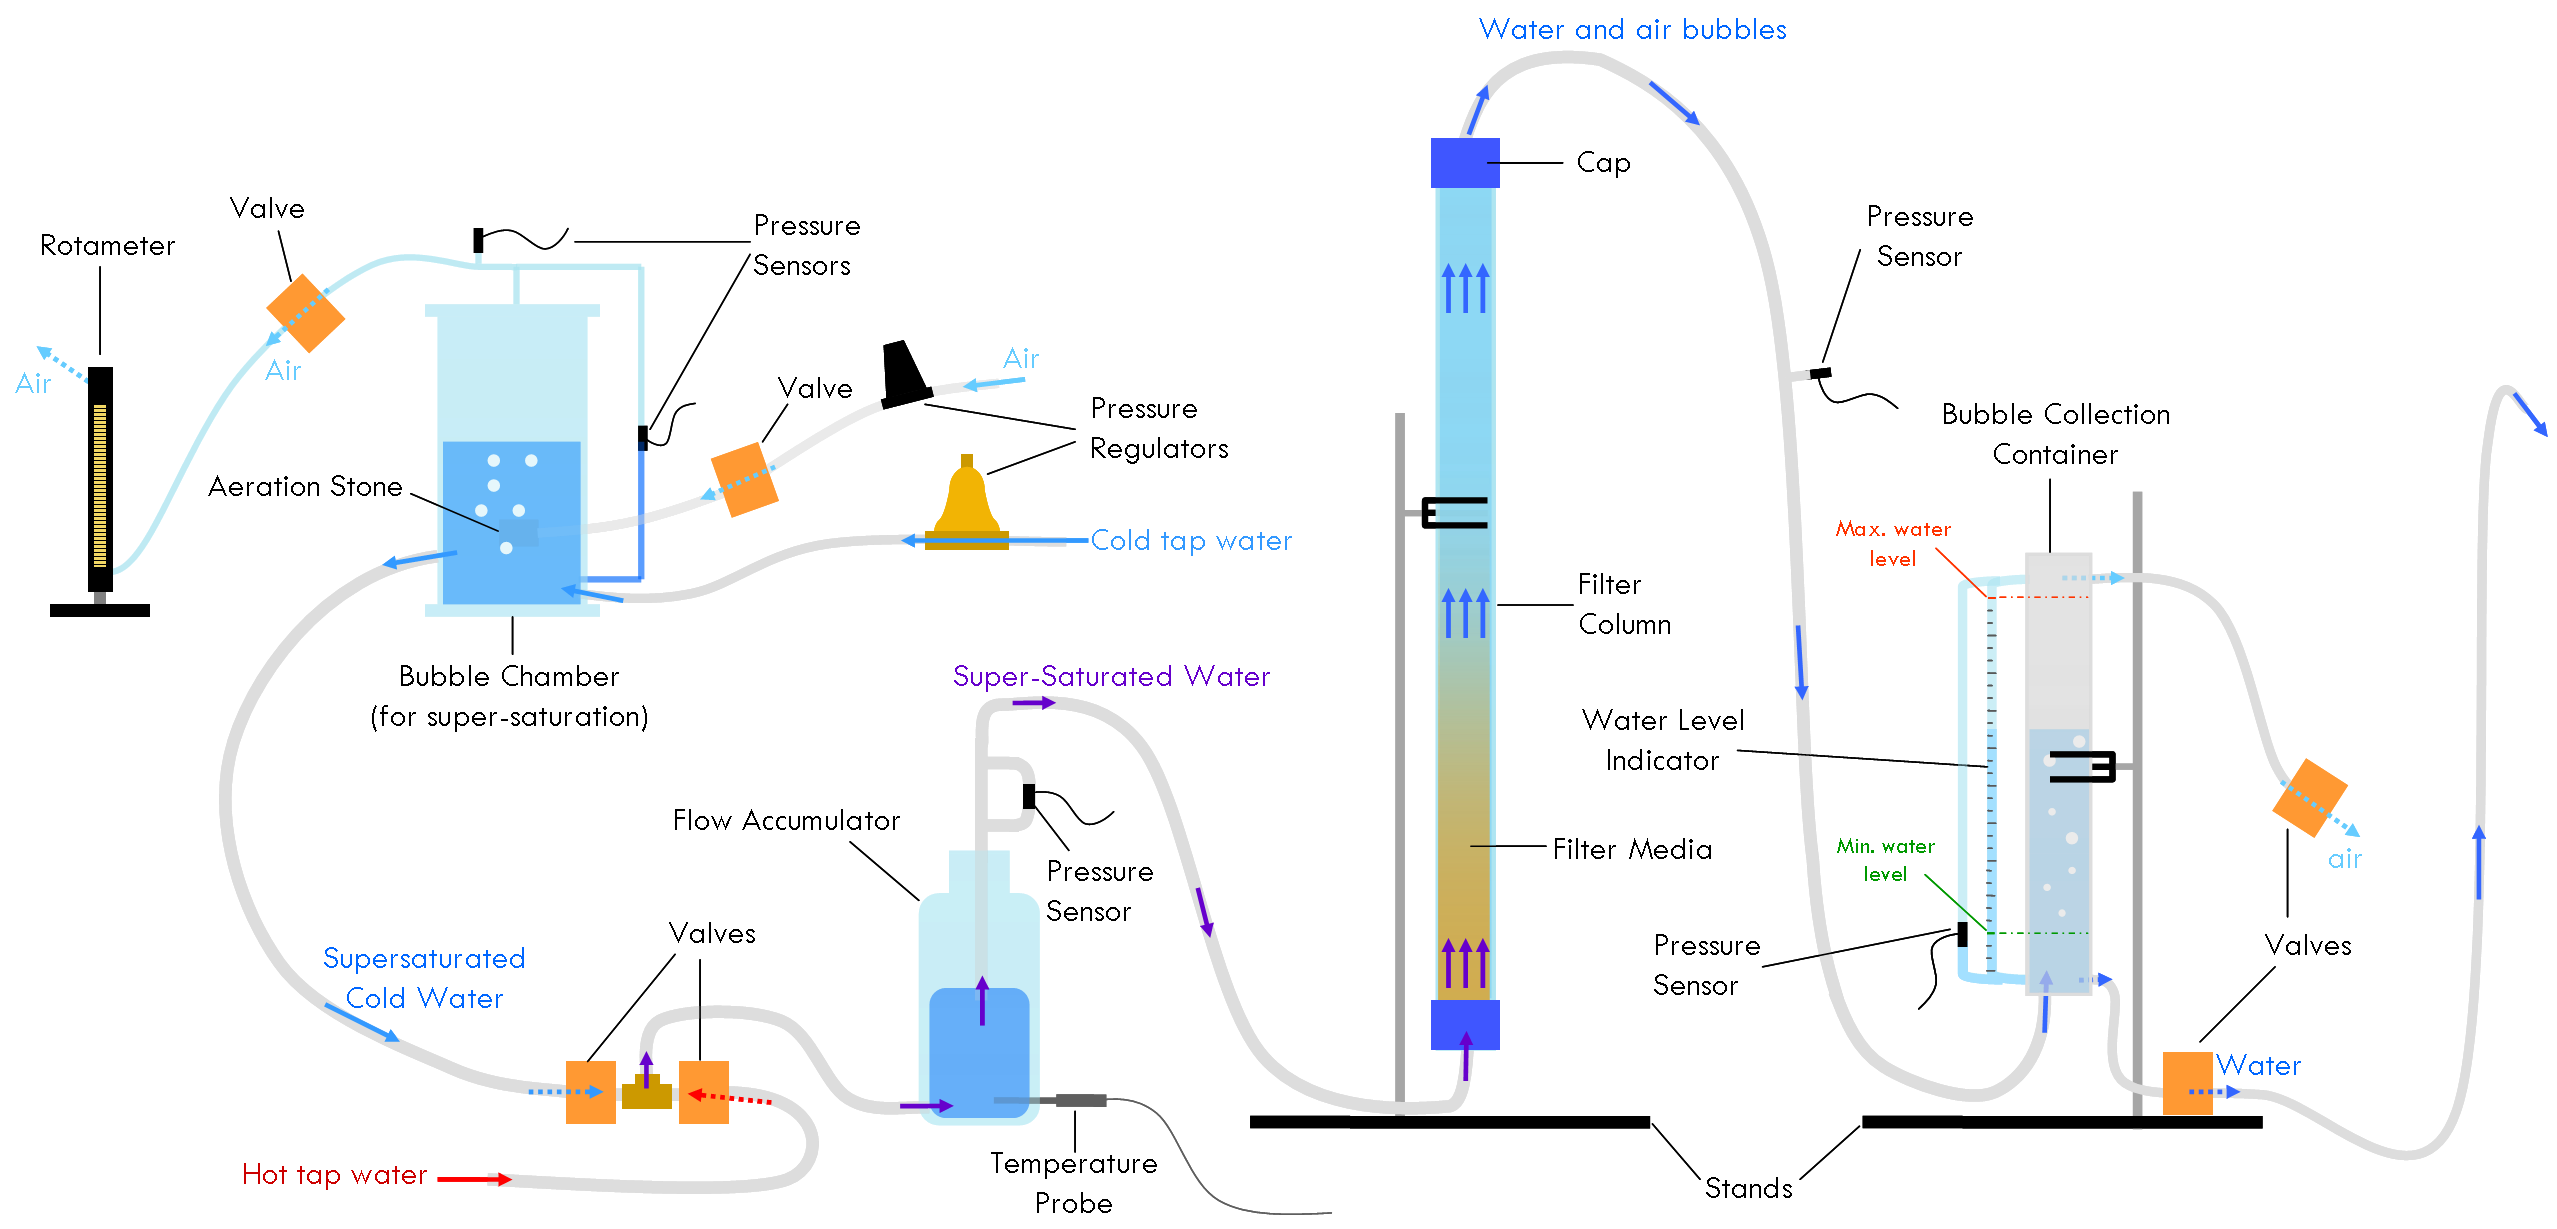
| PNG File SandFIlterSetup5.png | 181 kB | user-f9f3e | May 06, 2009 02:01 |
|
experimental setup (as of 4/23/09) | ||
| Version 1 (current) | 181 kB | user-f9f3e | May 06, 2009 02:01 | experimental setup (as of 4/23/09) | |||
| Microsoft Excel Sheet Cumulative Results, with aerator.xls | 1.82 MB | user-f9f3e | May 06, 2009 02:00 |
|
Data from current setup (which includes the aerator) | ||
| Version 1 (current) | 1.82 MB | user-f9f3e | May 06, 2009 02:00 | Data from current setup (which includes the aerator) | |||
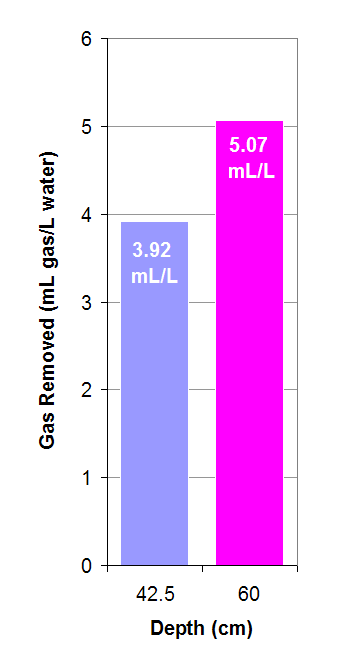
| PNG File Gas removal mL-L,40, 2depths.png | 4 kB | user-f9f3e | May 06, 2009 00:54 |
|
Figure 4: Gas removed, mL/L for 40 at 2 depths | ||
| Version 1 (current) | 4 kB | user-f9f3e | May 06, 2009 00:54 | Figure 4: Gas removed, mL/L for 40 at 2 depths | |||
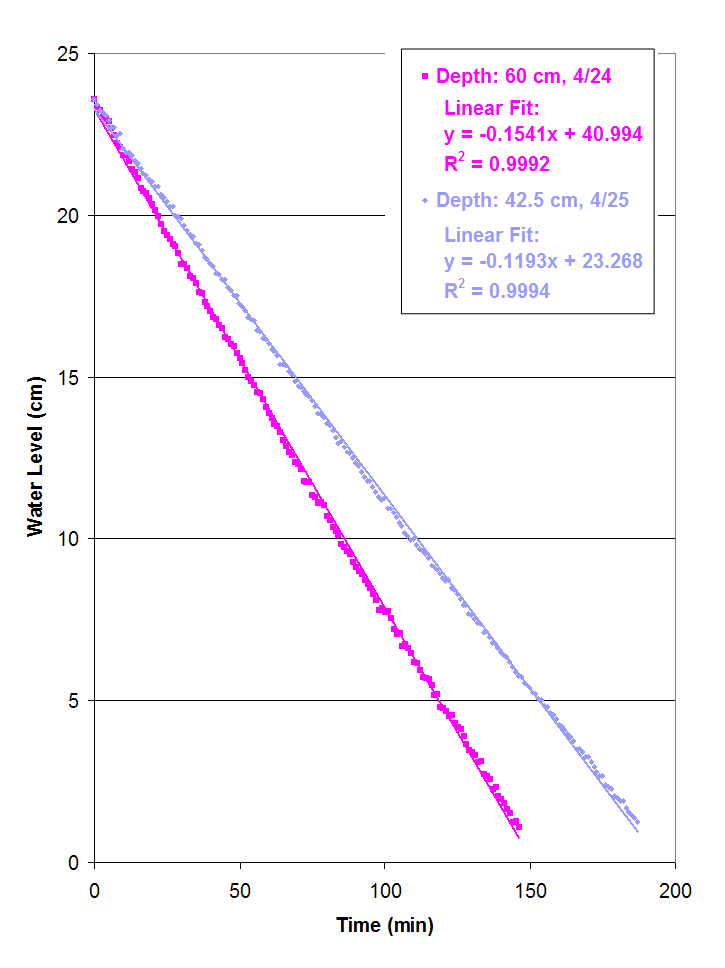
| PNG File Water Level vs. Time. 40, 2depths.png | 12 kB | user-f9f3e | May 06, 2009 00:54 |
|
Figure 3: Water Level vs. Time + linear interp. for 40 at 2 depths | ||
| Version 1 (current) | 12 kB | user-f9f3e | May 06, 2009 00:54 | Figure 3: Water Level vs. Time + linear interp. for 40 at 2 depths | |||
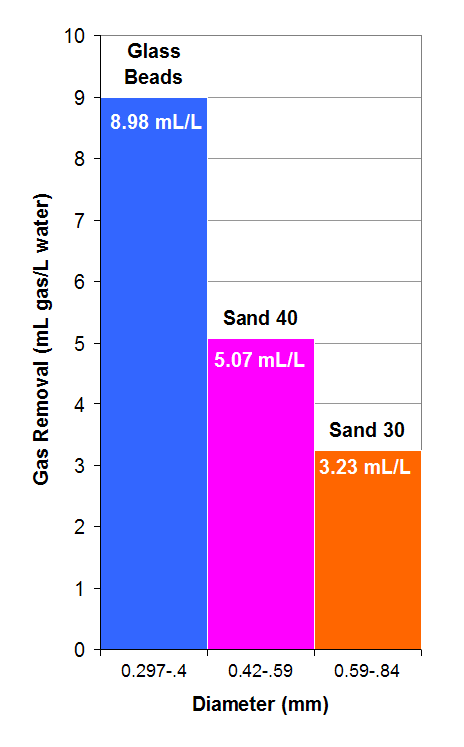
| PNG File Gas removal, mL-L. GB, 40, 30.png | 7 kB | user-f9f3e | May 05, 2009 23:40 |
|
Figure 2: Gas removed, mL/L for GB, 40, 30 | ||
| Version 1 (current) | 7 kB | user-f9f3e | May 05, 2009 23:40 | Figure 2: Gas removed, mL/L for GB, 40, 30 | |||
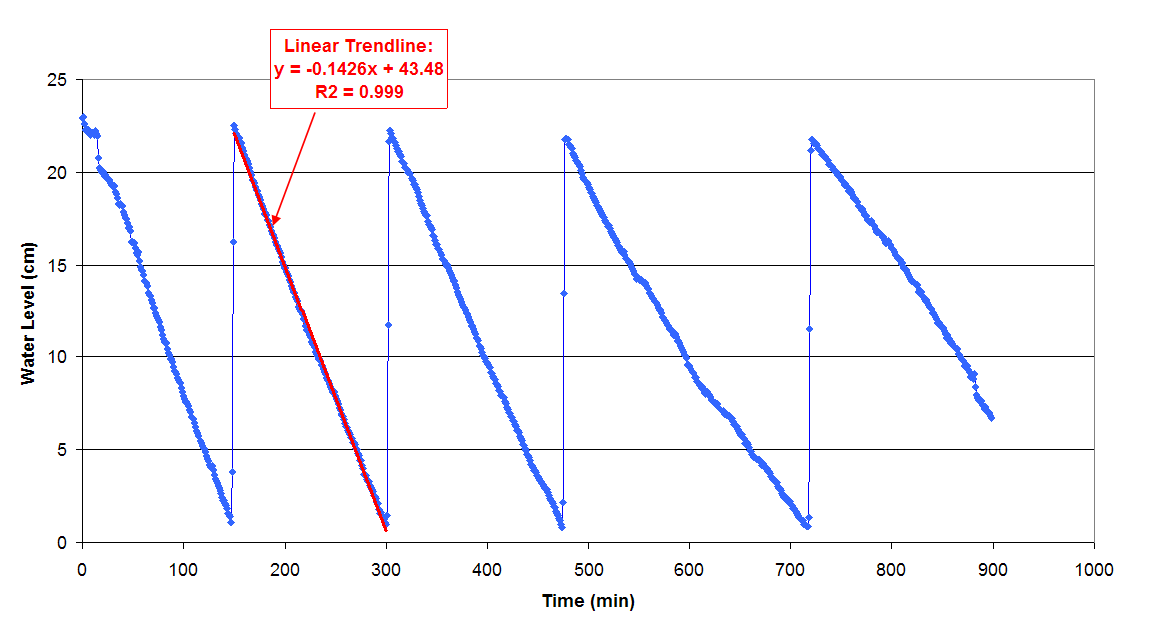
| PNG File Water level vs. Time, GB, raw data.png | 15 kB | user-f9f3e | May 04, 2009 19:36 |
|
Figure 1: Raw Data (and one trendline), Glass Beads, 180 mL/min | ||
| Version 1 (current) | 15 kB | user-f9f3e | May 04, 2009 19:36 | Figure 1: Raw Data (and one trendline), Glass Beads, 180 mL/min | |||
| File SandFilterConfiguration.pcm | 7 kB | user-f9f3e | May 03, 2009 20:56 |
|
Process Controller Method (as of 4/18/09) | ||
| Version 1 (current) | 7 kB | user-f9f3e | May 03, 2009 20:56 | Process Controller Method (as of 4/18/09) |
Attachments
Overview
Content Tools