 Sign-up for free online course on ANSYS simulations!
Unable to render {include} The included page could not be found.
Unable to render {include} The included page could not be found.
Response Surface
Start by double clicking on Response Surface in the Project Schematic window. Once the Response Surface window opens click Update Response Surface. After, the update has completed click on Response to see a plot of the maximum Von Mises stress as a function of hole radius. In order to display a plot of the volume as a function of the hole radius, change the value assigned to Y axis to P3 EquivalentStressMax.
Maximum Von Mises Stress
The plot below shows the maximum Von Mises stress as a function of the hole radius.

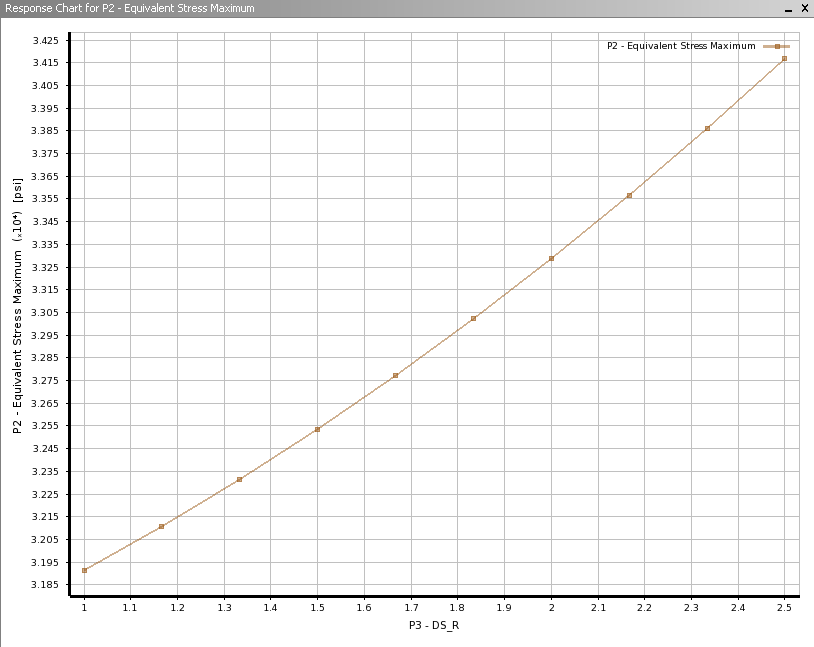
As expected, the maximum Von Mises Stress increases as the radius increases.
Volume
The plot below shows the volume of the quarter plate as a function of the hole radius.


The relation between radius and volume is quite trivial to compute. It will simply be the area of the surface multiplied by the thickness of the surface. With this in mind, V=t*(h*w-(1/4)*pi*r^2) where V=volume, t=thickness, h=height, w=width and r=radius.
At this point, click Return To Project and then save the project.