 Sign-up for free online course on ANSYS simulations!
Error formatting macro: include: java.lang.IllegalArgumentException: No link could be created for 'SIMULATION:ANSYS WB - Plate With a Hole - Panel'.
Results
Displacement
Okay! Now we can check our solution. Let's start by examining how the plate deformed under the load. Before you start, make sure the software is working in the same units you are by looking to the menu bar and selecting Units > US Customary (in, lbm, lbf, F, s, V, A). Now, look at the Outline window, and select Solution > Total Deformation.
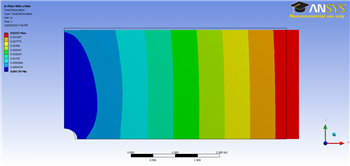
The colored section refers to the magnitude of the deformation (in inches) while the black outline is the undeformed geometry superimposed over the deformed model. The more red a section is, the more it has deformed while the more blue a section is, the less it has deformed. Notice that the deformation is at its highest where the load is applied, and there is no a lot of variation in the y-direction, as one intuitively expect.
Sigma-xx
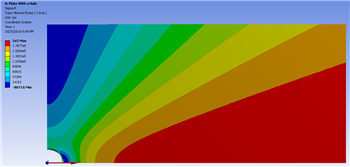
Now lets examine the stress in the x-direction. Look to the Outline window, then click Solution > Sigma-xx

From this, you can see that most of the plate is in constant stress, and there is a stress concentration around the hole. The more red areas correspond to a high, tensile (positive) stress and the bluer areas correspond to areas of compressive (negative) stress. Let's use the probe tool to compare the ANSYS simulation to what we expected from calculation. In the menu bar, click the Probe button; this will allow you to hover over the model and it will display the stress at each point. 
Start by hovering over the area far from the hole. The stress is about 100,000 psi, which is the value we would expect for a plate with constant traction. If you click the max tag (located next to the probe tool in the menu bar), it will locate and display the maximum stress, which is shown as 3.0335e5 psi. This is about a 0.0055% difference from the calculation we did in the Pre-Analysis, which shows that the FEA is very, very accurate!
Sigma-r
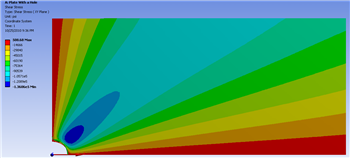
Now let's look at the radial stresses in the plate. Look to the outline window and click Solution > Sigma-r. This will display the radial stresses.
Does this match what we expect? Let's first look at the case when r >> a. As we found in the pre-calculations, when r >> a, the radial stress is a function of the angle theta only. This matches the behavior seen in the simulation. From our Pre-Calculations, we also found that
Unknown macro: {latex}
\large $ \theta = 0, \sigma_
Unknown macro: {r}
= \sigma_
Unknown macro: {o}
$
Using the probe tool, we find that indeed at this location, the stress is equal to 200,000 psi, which is the value we calculated in our Pre-Analysis. Also from our Pre-Analysis, we found that when
Unknown macro: {latex}
\large $ \theta = \frac
Unknown macro: {pi}
Unknown macro: {2}
, \sigma_
Unknown macro: {r}
= 0 $
Checking the simulation with our trusty probe tool, we find that the ANSYS simulation matches up quite nicely with our calculation.
Sigma-Theta
Now, let's compare the simulation to our pre-calculations for the theta stress. Look to the Outline window, then click Solution > Sigma-theta

In our pre-analysis, we determined that when r >> a, theta stress is a function of theta only. This behavior is represented in the simulation. Also, at the points such that r >> a and
Unknown macro: {latex}
$ \theta = \frac
Unknown macro: {pi}
Unknown macro: {2}
$
the stress is equal to
Unknown macro: {latex}
$ \sigma_
Unknown macro: {o}
$
Using a probe tool and hovering over this area, we see that the stress is indeed about F/A in the simulation. However, looking at the area when
Unknown macro: {latex}
$ \theta = 0 $
we find that the stress from the simulation is between 1000 psi and 2000 psi. Although this seems large compared to zero, one must keep in mind that the stress at this location is 1% of the average stress. We expect that the stress here will get closer to zero on refining the mesh since the finite-element error becomes smaller.
Tau-r-theta
Now let's look at how the simulation match our predictions for the shear stress. Look to the Outline window, then click Solution > Tau-r-theta
In our pre-calculations, we determined that far from the hole the shear stress should be a function of theta only. This can be shown by using the probe tool a hovering over a radial line from the hole. The colors (representing higher and lower stresses) only change only as the angle changes, but not as the move away from the hole. We also found that far from the hole at
Unknown macro: {latex}
$ \theta = 0 \mbox
Unknown macro: { and }
\theta = \frac
Unknown macro: {pi}
Unknown macro: {2}
$
the stress is zero. Using the probe tool, we can see that this is indeed the case for the simulation as well.
Continue to [Step 7 - Verification and Validation ]
Go to all ANSYS Learning Modules