Experiment 1: Alum Dose of 25 mg/L
In order to determine whether adding alum to the raw water would improve filter performance, an alum dose and rapid mix were added to the experimental set up. In this trial, we used an alum dose of 25 mg/L, 3 inch depth of 90 ppi foam, with the flow rate ramped between 50 and 200 m/day.
The figure below shows both the raw water turbidity and the effluent turbidity as a function of the flow rate. The effluent turbidity increases with the flow rate. This shows that filter performance decreases with increasing flow rates, meaning that in order to achieve a desirable effluent turbidity, a lower flow rate and thus a larger filter tank size must be employed. As show in the graph, filtration velocities of less than about 2 mm/s produce an effluent turbidity of less than one, or a pC* of greater than 0.9 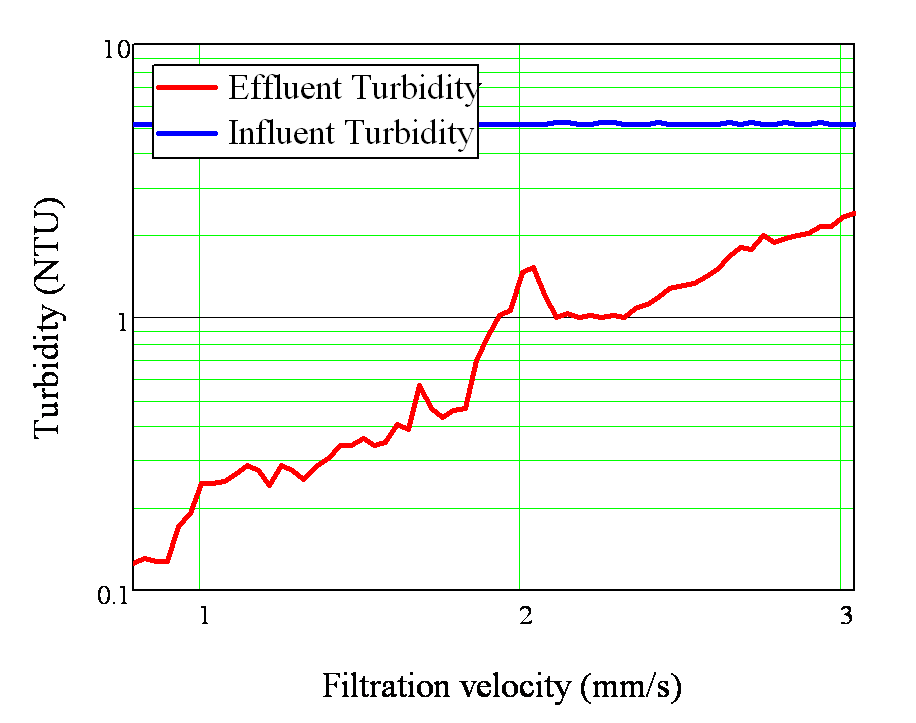
Figure 1: Raw Water and Effluent Turbidity vs Flow Rate
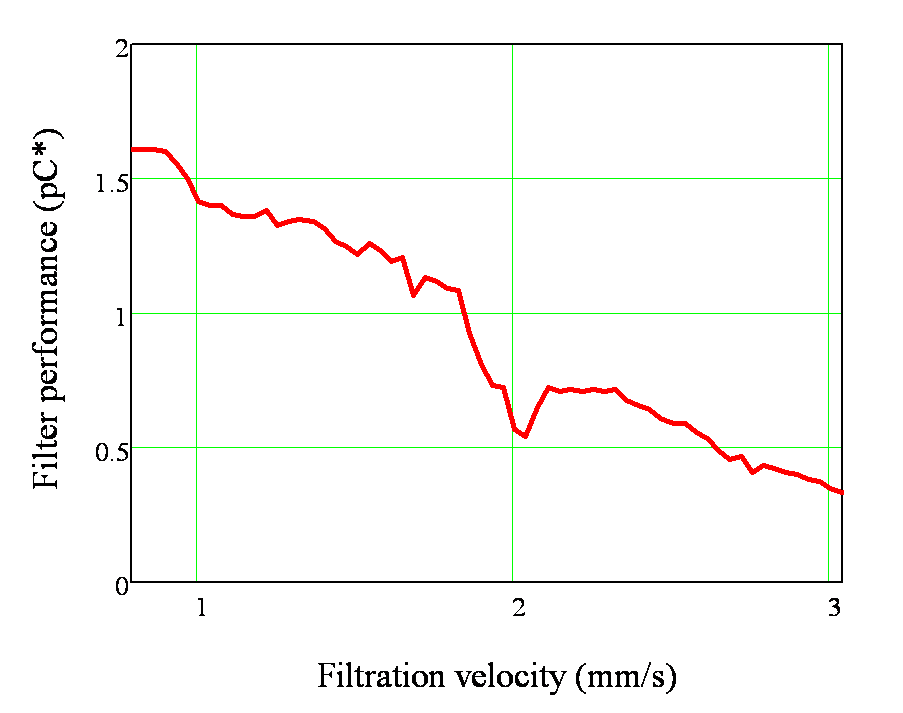
Figure 2: pC* vs Flow Rate
While the results obtained using this alum dose were phenomenal, this is a very high, unrealistic alum dose. To actually achieve this alum dose level, it would be necessary to install an additional alum doser prior to the filtration unit.
Experiment 2: Alum Dose of 1.5 mg/L
A more realistic alum dose of 1.5 mg/L was used in this experiment. This value was calculated based on the assumption that about 5% of the particles remain, and they were originally exposed to a 30 mg/L alum dose prior to flocculation and sedimentation. The 5% remaining particles estimation is based on the idea that 5 NTU is 5% of 100 NTU, which is a rough estimate of the raw water turbidity coming into an AguaClara plant. Therefore, our alum dose is 1.5 mg/L, which is 5% of of 30 mg/L. This experimental trial was also run using a 3 inch depth of 90 ppi foam, with the flow rate ramped between 50 and 200 m/day.
Additionally, this experiment was done using 3 consecutive ramp states. This was done because a layer of particles forms on top of the foam sheets during the duration of the experiment. The 3 ramp states allow us to see if the flow rate going through the filter or the layer of film was governing filter performance.
Figure 3 shows the three ramp states as a function of flow rate. The first ramp state has a significantly higher turbidity than the following two. This means that the layer of film on top of the foam sheets is affecting filter performance, and this needs to be considered when designing a filtration unit. 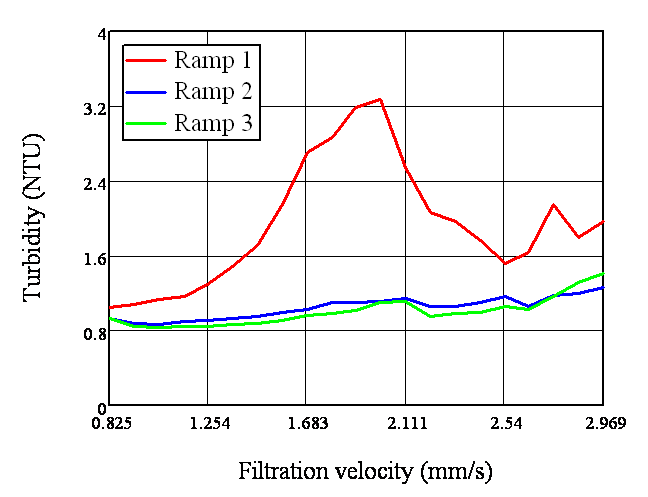
Figure 3: Effluent Turbidity vs. Flow Rate