90 ppi Flat Foam Sheet
Experiment 2.1: 90 ppi foam with flow rate varying from 50-250 m/day
After testing the filtering capacity of the 60 ppi foam, 90 ppi foam was tested in hopes of achieving a higher filtration performance. Rather than testing the foam at constant flow rates, as done previously, a ramp state was employed. Over the course of a 24 hour period, the flow rate through the foam sheet was gradually increased from 50 m/day to 250 m/day. This variation of flow rates will indicate whether the filtering capacity of the foam is affected by flow rate or not. As with the tests conducted on the 60 ppi foam, raw water of 5 NTU without alum dosage was used.
Rate_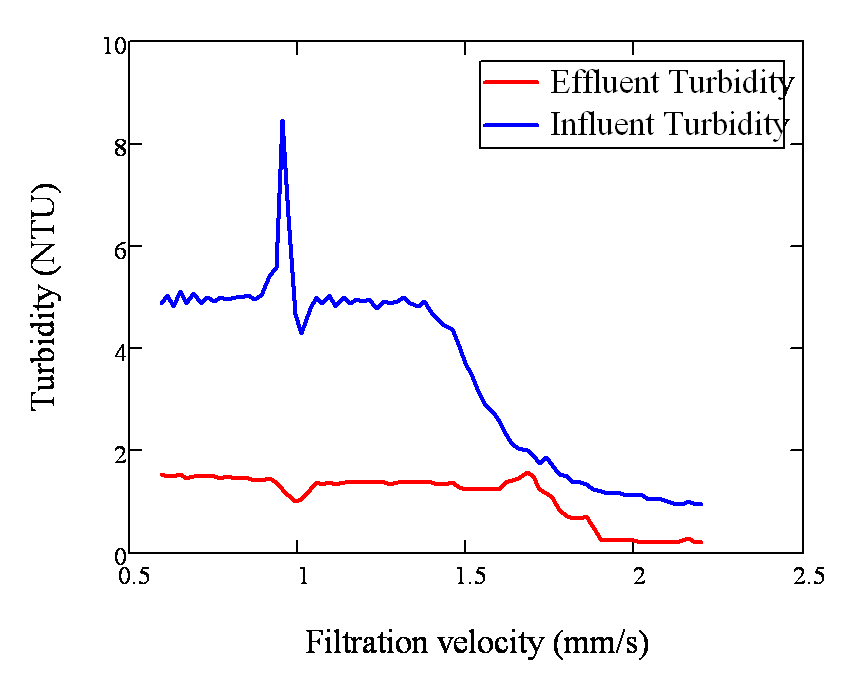
_Figure 1: Raw Water and Effluent Turbidity vs. Flow
A few things to note about Figure 1:
- The effluent turbidity is approximately constant at 1.5 NTU, despite the varying flowrate.
- The effluent turbidity is about the same as the 60 ppi.
- The clay stock ran out for this experiment around the mark for 130 m/day, therefore the data collected after this point is not applicable to the flow rate experiment.
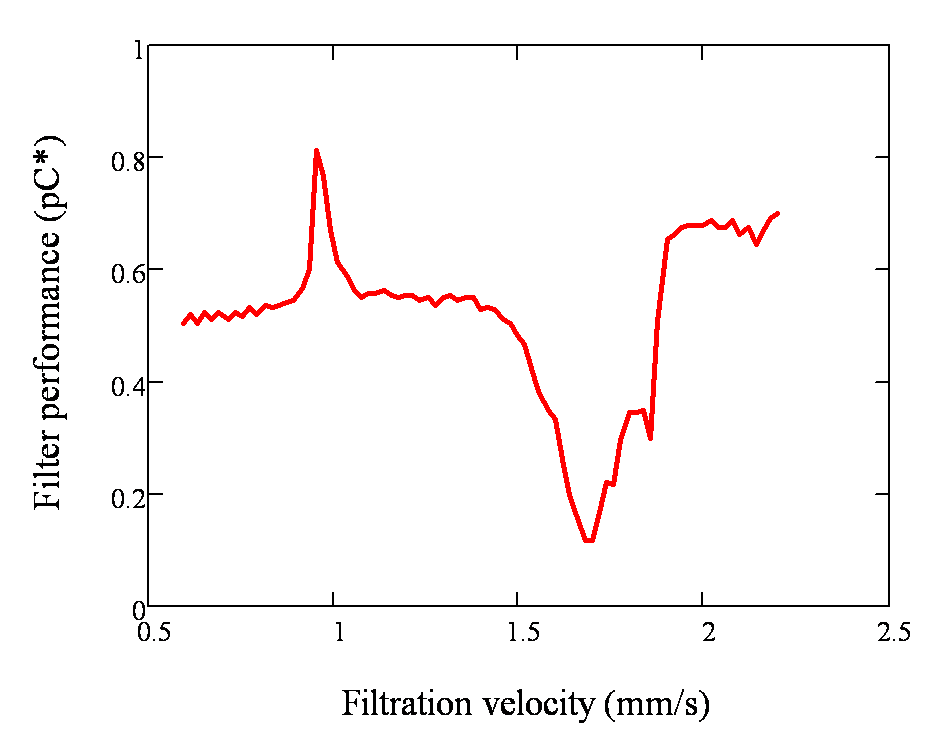
Figure 2: PC* vs Flow Rate
A few things to not about Figure 2:
- The percent colloid removal remains relatively constant despite the increasing flowrate. Therefore, at these levels, filtration performance is not affected by increase flow rate.
- As evidenced by the range of flow rates from 170-190, which is after the raw water turbidity dropped, the percent colloid removal is still constant at about 55%
- Again, this level of colloid removal of 55% is not at the optimum level of 90%.
- This constant pC* achieved suggests that the filtering capacity of foam may be dependent on particle size, which means the foam cannot remove any particles smaller than a given size, regardless of the influent turbidity.