 Sign-up for free online course on ANSYS simulations!
Unable to render {include} The included page could not be found.
Step 6: Results
In Workbench save your project. In Project Schematic window, double click on Results to open CFD-Post.
Overview
Again, like previous section, we see familiar Outline tab on the left that display various results of interest. On the right, we have the Graphics window.
Temperature Contour
Let's first look at temperature Contour. On the top menu, click on contour  . Enter name "Temperature Contour" and press OK. On the left hand side, under Details of Temperature Contour, select the appropriate parameter to obtain the result we want. Next to Locations, select periodic 1. Select Temperature for Variable. Enter 100 for # of Contours.

Next, click on the View tab. We would like to specify the look of the contour plot. Select Apply Reflection/Mirroring. Select ZX Plane next to Method. This will reflect our model in the ZX Plane and enable us to look at the temperature contour at the cross section of of the pipe. Next, select Apply Scale. Enter 30 for y-axis. This will stretch our model in the y direction. This will enable us to better view how the flow is mixed in the whole pipe. Finally click Apply.

After you click Apply, you will see that under Outline > User Locations and Plots, Temperature Contour is created. You will also see that the Temperature Contour is plotted in the Graphics window on the right. Under Outline > User Locations and Plots, uncheck Wireframe to see just the Temperature Contour in the Graphics window.

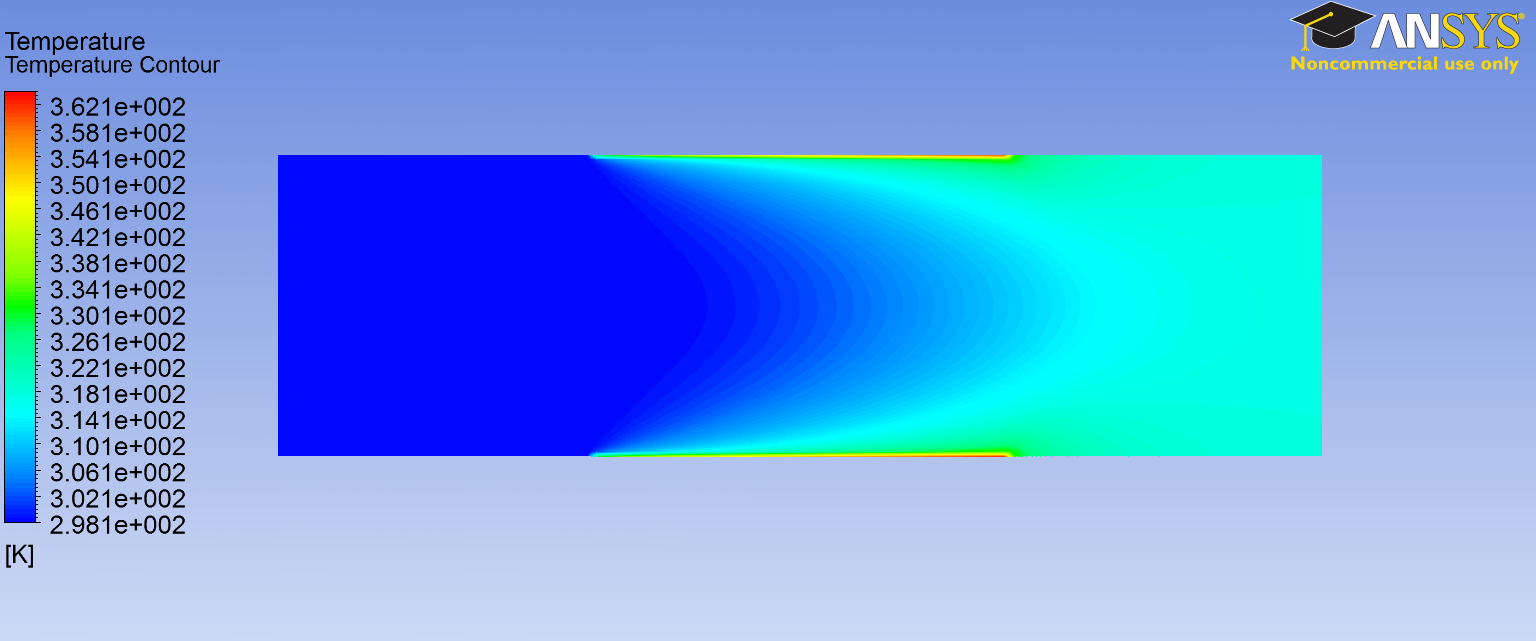
Is the flow well mixed at the end of adiabatic mixing section?
Velocity Vectors
On the top menu, click on vector  . Name it Velocity Vector and click OK. Under Details of Velocity Vector, select periodic 1 next to Locations.

Next, we will specify how the arrow will appear. Click on Symbol tab. Enter 0.05 for Symbol Size.

Finally click Apply. You will see that under Outline > User Locations and Plots, Velocity Vector is created. Uncheck Temperature Contour so that Graphics window shows just the Velocity Vector plot.


Velocity vectors in the first section showing flow development.