Results and Discussion of Initial Experiments
Unknown macro: {float}
Since there were problems with the DO probes we used in the initial experimental setup, we switched to measuring the total volume of the bubbles that form inside the filter column. Using MathCad, we used the bubble volume collected to calculate the equivalent DO concentration removed from the water.
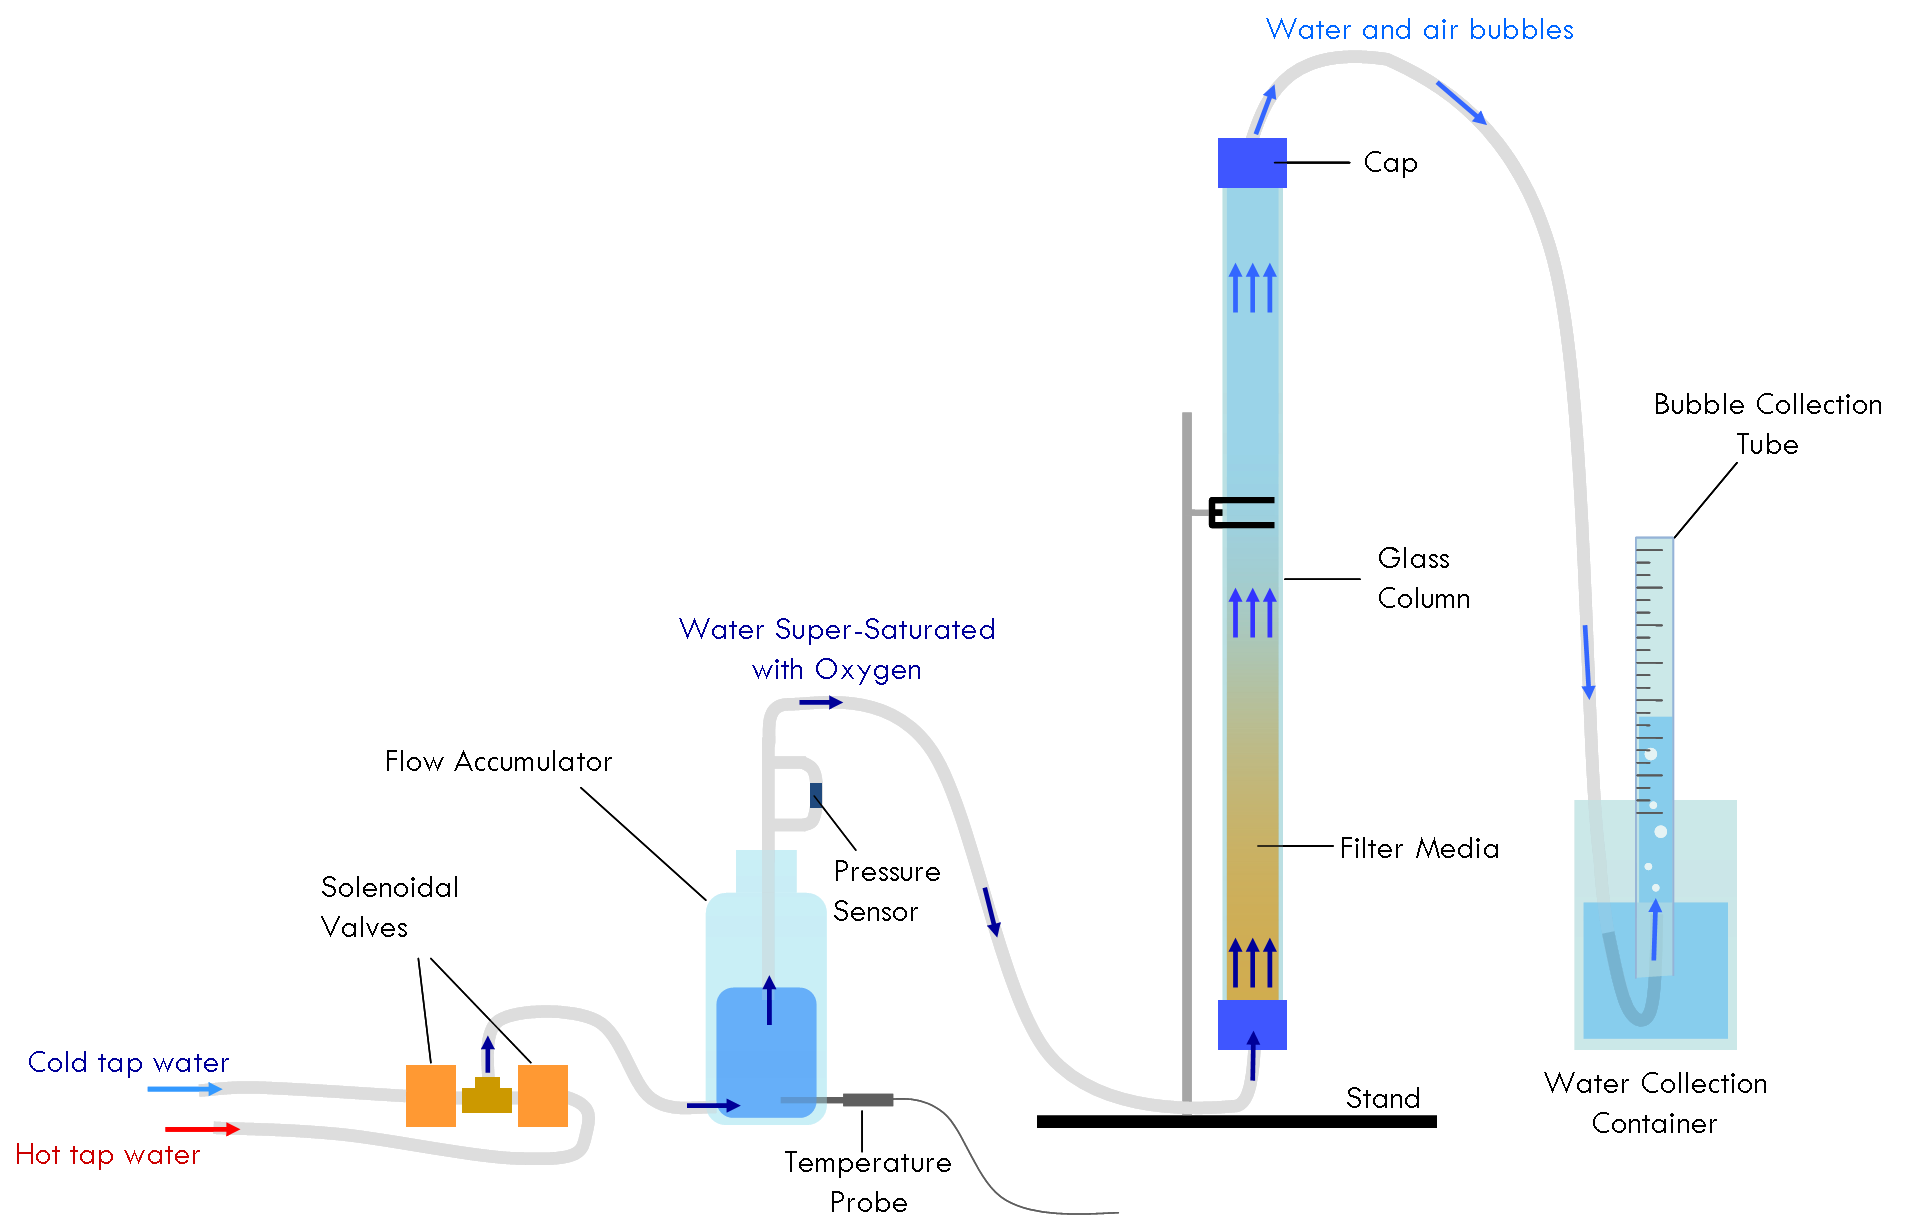
The only changes in the setup were to remove the DO probes and instead feed the water leaving the filter column into an inverted graduated cylinder. This cylinder was filled with water and had its mouth submerged in water. As bubbles formed in the filter media, they flowed out into this cylinder and floated to the top, displacing some water and causing the water level inside the cylinder to fall. The air volume was measured every 10 minutes during each run, using the calibrations on the side of the cylinder.
The first experiment run using this bubble collection method used glass beads as the filter media, with a flow rate of 200 ml/min and an unsuspended filter depth of 32 cm. We observed that the performance of the system increased for about 20 minutes, after which the rate of the increase in air volume became relatively constant. This is illustrated in Figure 1, below. After 20 minutes, the line becomes nearly linear. We concluded that the experiment needs run for at least 20 minutes in order for the data to become steady and reliable, and that we would start recording data after at least 20 minutes of runtime.
Unknown macro: {float}
Unable to render embedded object: File (BubbleVol vs. Time, 200mLmin.png) not found.
Figure 1 Total bubble volume collected over time with a flow rate of
200 ml/min and a sand depth of 32 cm.
Next, we experimented with the glass bead depth. At a flow rate of 200ml/min, we obtained the following results:
Unknown macro: {float}
Unable to render embedded object: File (Varied Depth.png) not found.
Figure 2 The effect of varying glass bead depth at a flow rate of
200 ml/min.
Figure 2 shows that a glass bead depth of 10cm is better than the larger glass bead depth of 32cm. Logically, this result did not make sense, so we repeated the experiment at a later date. Figures 3 and 4 below illustrate these results, which show that a larger filter depth extracted more DO.
Unknown macro: {float}
Unable to render embedded object: File (DO removed vs. time, fig 3.png) not found.
Figure 3 DO concentration versus time at varying depths and
flow rates.
Unknown macro: {float}
Unable to render embedded object: File (DO removed vs. time, fig 4.png) not found.
Figure 4 DO concentration versus time at varying depths and flow
rates This graph is the same as Figure 3, but the results from the flow
rate of 150 ml/min at 33 cm filter depth are excluded.
The DO stripped from the water flowing at 150 mL/min through the 33 cm filter was much greater than at the other flow rates and depths. This was probably because the 150mL/min run was at a greater filter depth, which meant we needed to add glass beads to the column. A lot of air came in with the dry beads, and we most likely did not allow sufficient runtime afterward in order to allow all the trapped air to escape before we began recording the data. By the time we ran that depth at the lower flow rate, the extra air had left and we were gathering only the air being stripped from the water.
Figure 4, above, shows the same results as Figure 3 but omits the 150 mL/min at 33 cm data, making the results from this run easier to see. Clearly, the greater filter depth resulted in the removal of more dissolved oxygen than the lower depth. The flow rate was not varied enough to have much impact on the effectiveness of this method.
We compared the DO removal according to the DO probes and to our calculations using the total collected bubble volume.
Unknown macro: {float}
Unable to render embedded object: File (DO removed, measured and calculated, 10cm.png) not found.
Figure 5 DO removed, measured by the DO probes as well as by
calculating equivalent DO using the collected bubble volume. Sand
depth of 10 cm, flow rate of 200 mL/min.
Unknown macro: {float}
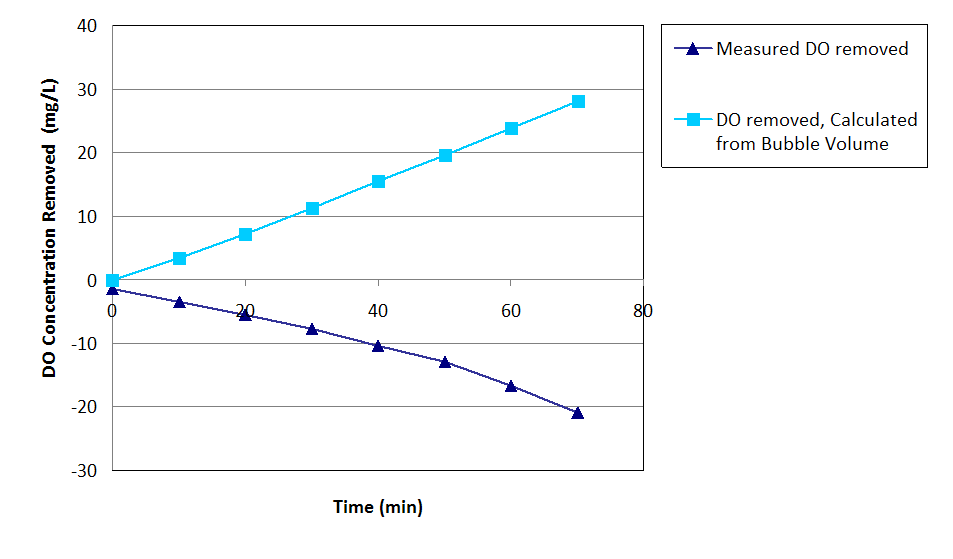
Figure 6 DO concentration removed, measured by the DO probes
as well as by calculating equivalent DO using the collected bubble
volume. Sand depth of 33 cm, flow rate of 200 mL/min.
Figures 5 and 6 further show that the DO concentrations recorded by the DO probes were not reliable. The DO stripped from the water according to the DO probes appeared very different from the DO removed that was calculated from the collected air volume. Figure 5 reveals a large discrepancy between the DO probes' data and the actual volume of water collected. Figure 6 shows that the DO probes were in fact recording that oxygen was added to the water during the process, although the volume of air collected from the water was definitely increasing.
Conclusion
We have not yet drawn any final conclusions. The data collected was not reliable or stable, due to many problems, such as the DO probes not reading the concentration correctly. We may tentatively conclude that greater filter depth removes more dissolved oxygen, but further research is necessary. We will be able to draw firmer conclusions when the problems of the setup are fixed and we have a more accurate and precise method of measuring the collected air volume.