Sign-up for free online course on ANSYS simulations!
Author: Rajesh Bhaskaran & Yong Sheng Khoo, Cornell University
Problem Specification
1. Create Geometry in GAMBIT
2. Mesh Geometry in GAMBIT
3. Specify Boundary Types in GAMBIT
4. Set Up Problem in FLUENT
5. Solve!
6. Analyze Results
7. Refine Mesh
Step 6: Analyze Results
Display Pressure Contours
Main Menu > Display > Contours

Under Contours of, choose Pressure.. and Static Pressure. Select the Filled option. Increase the number of contour levels plotted: set Levels to 40. Click Display.

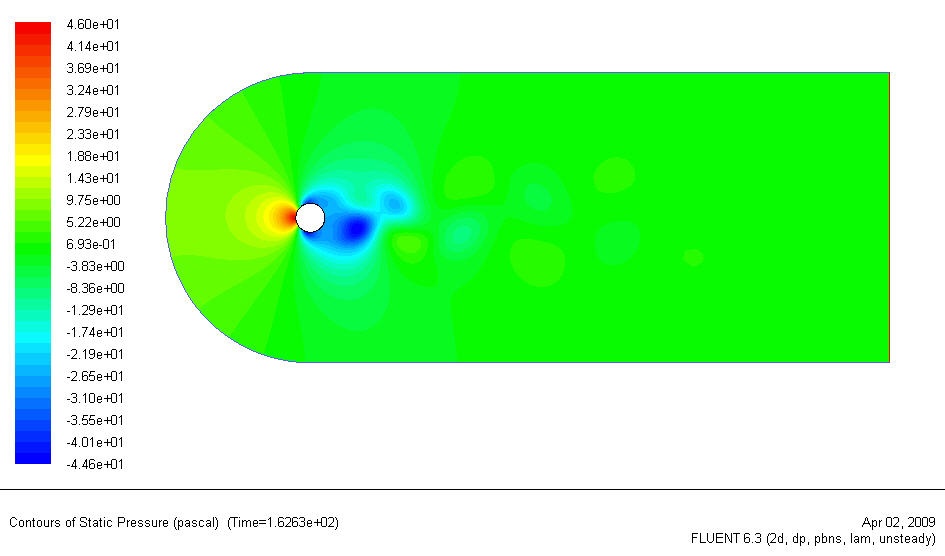
The contour shows a clear asymmetric pattern in the flow.
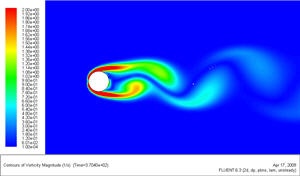
Display Contour of Velocity Magnitude
Main Menu > Display > Contours
 \\\\
\\\\
Under Contours of, choose Velocity.. and Vorticity Magnitude. Disable Auto Range and Clip to Range from the Options group box. Enter 0.0001 and 2 for Min and Max, respectively. Select Levels to 50. Click Display.
//  //
//