 Sign-up for free online course on ANSYS simulations!
...
We want this at a fine enough granularity so that we can see the pressure changes clearly. Under Levels, change the default 20 to 40. This increases the number of lines in the contour plot so that we can get a more accurate result.
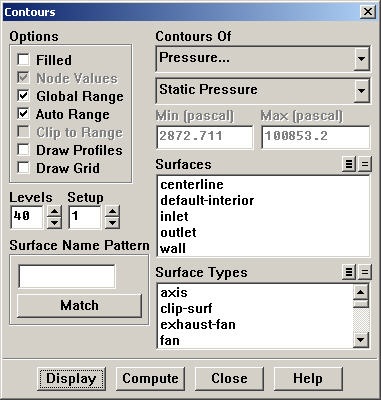
Click Display.
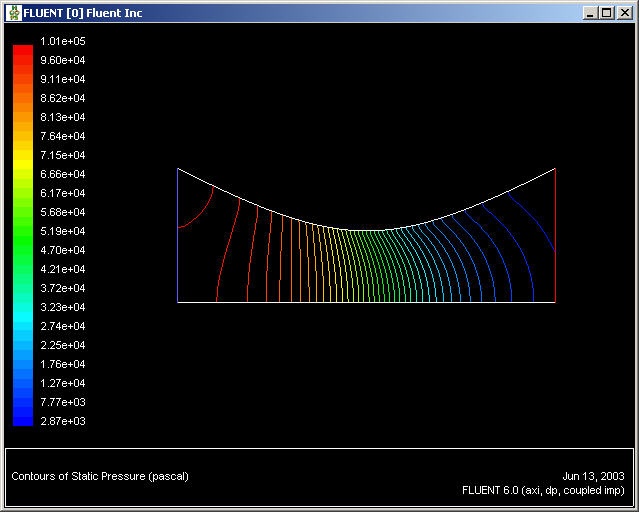
(Click picture for large image)
Notice that the pressure on the fluid gets smaller as it flows to the right, as is consistent with fluid going through a nozzle.
Temperature Contour Plot
Now we will plot the temperature contours and see how the temperature varies throughout the nozzle.
Back in the Contours window, under Contours Of, select Temperature... and Static Temperature.
Click Display.
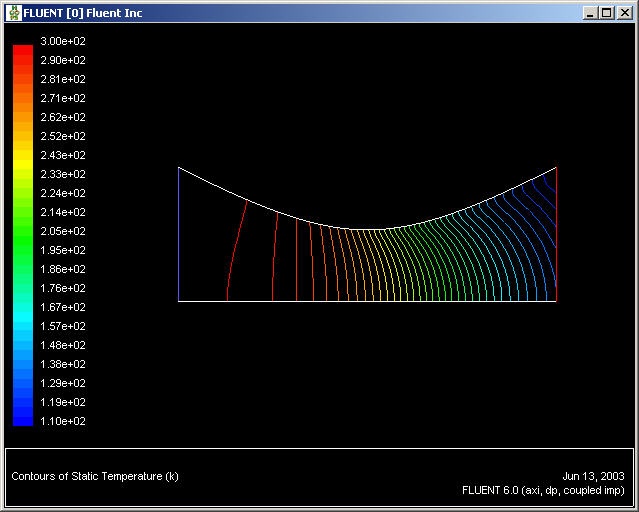
(Click picture for large image)
...