 Sign-up for free online course on ANSYS simulations!
| Include Page | ||||
|---|---|---|---|---|
|
| Panel |
|---|
Authors: Rajesh Bhaskaran & Sebastien Lachance-Barrett, Cornell University
...
Created using ANSYS 14.5
Geometry
| Note |
|---|
For users of ANSYS 15.0, please check this link for procedures for turning on the Auto Constraint feature before creating sketches in DesignModeler. |
Geometry (Artery without plaques)
...
| Wiki Markup |
|---|
{html}<iframe width="600" height="338" src="//www.youtube.com/embed/FR8jDB73U_A" frameborder="0" allowfullscreen></iframe>{html} |
...
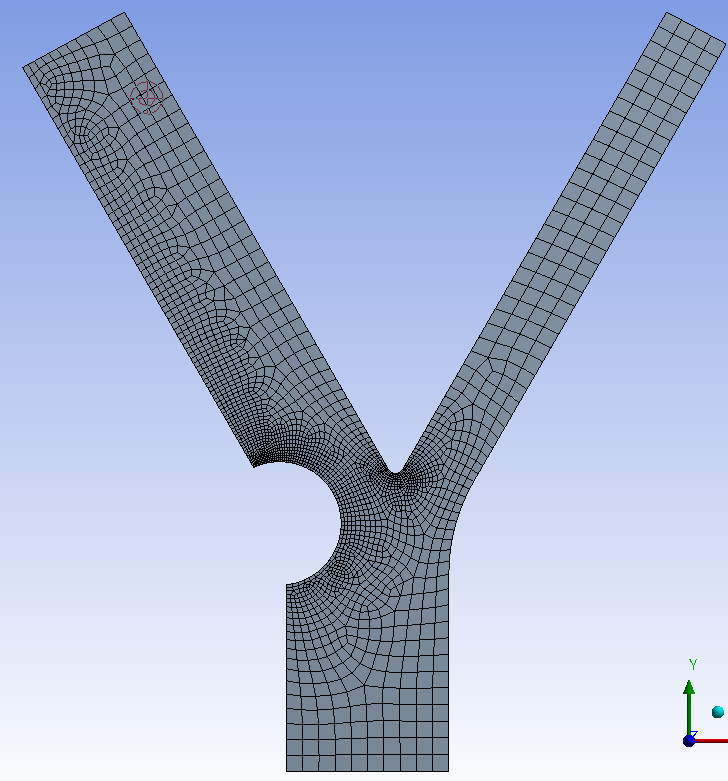
You can give a bias to edge sizing to cluster cells towards one end of edge. See this page for how to implement a bias to an edge.
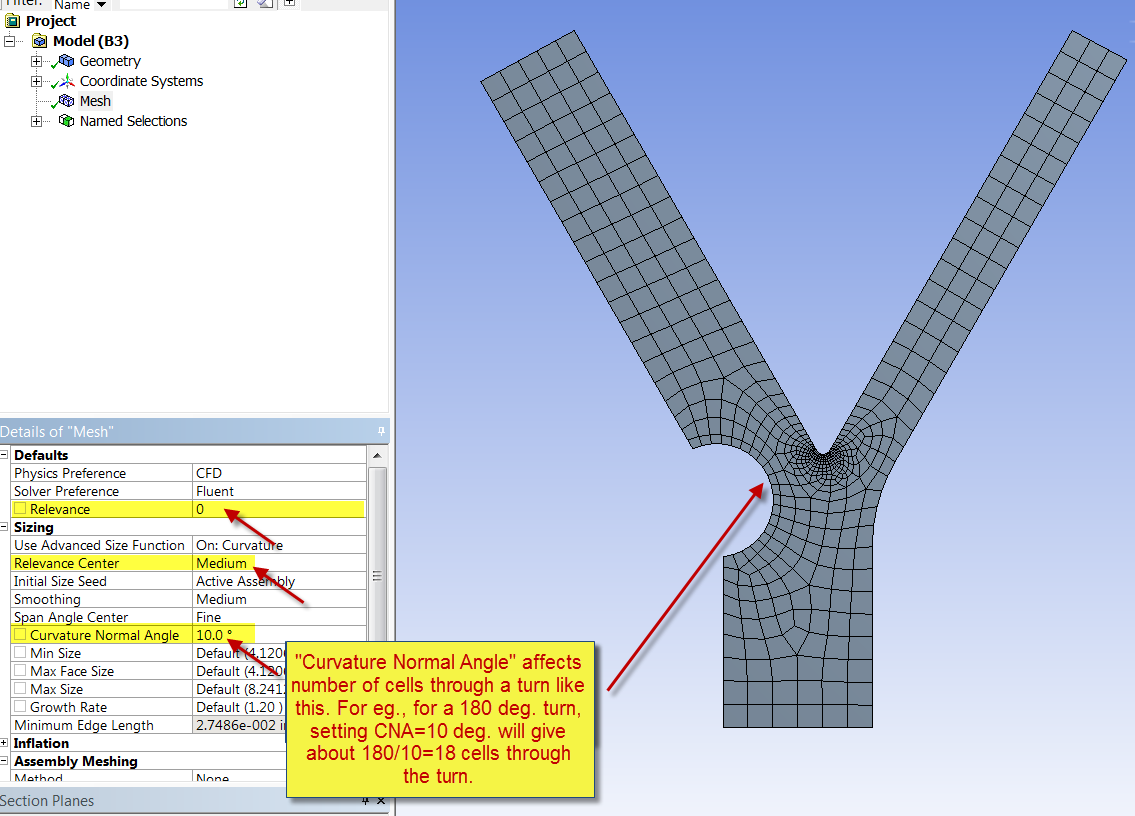
Below is a mesh we obtained by playing with these settings. This mesh resolves the separated flow behind the plaque better than the default mesh. It can be further improved though! You could start by changing the "edge sizings" in the left branch.
Streamlines
The following videos show how to plot streamlines using the CFD Post post-processor included in ANSYS Workbench. First, we plot streamlines emanating from the the inlet.
| Wiki Markup |
|---|
{html}<iframe width="600" height="338" src="//www.youtube.com/embed/hsAJpBRQPkY" frameborder="0" allowfullscreen></iframe>{html} |
The streamlines emanating from the inlet do not include those in the recirculating region or the "deadwater" region. To see the streamlines in the recirculating region, we:
- Create points along a line within the recirculating region
Plot streamlines emanating from these points
Wiki Markup {html}<iframe width="600" height="338" src="//www.youtube.com/embed/IyJyuNxO7pg" frameborder="0" allowfullscreen></iframe>{html}
...
The following video shows how to plot wall shear along the left wall of the bifurcating artery.
| Wiki Markup |
|---|
{html}<iframe width="600" height="338" src="//www.youtube.com/embed/OKhkffR4V3A" frameborder="0" allowfullscreen></iframe>{html} |
Pressure Gradient
The procedure to create a contour plot of the pressure gradient is shown in the video below.
| Wiki Markup |
|---|
{html}<iframe width="600" height="338" src="//www.youtube.com/embed/fSeuv88FNMM" frameborder="0" allowfullscreen></iframe>{html} |
Comments
| Include Page | ||||
|---|---|---|---|---|
|
| Include Page | ||||
|---|---|---|---|---|
|