 Sign-up for free online course on ANSYS simulations!
...
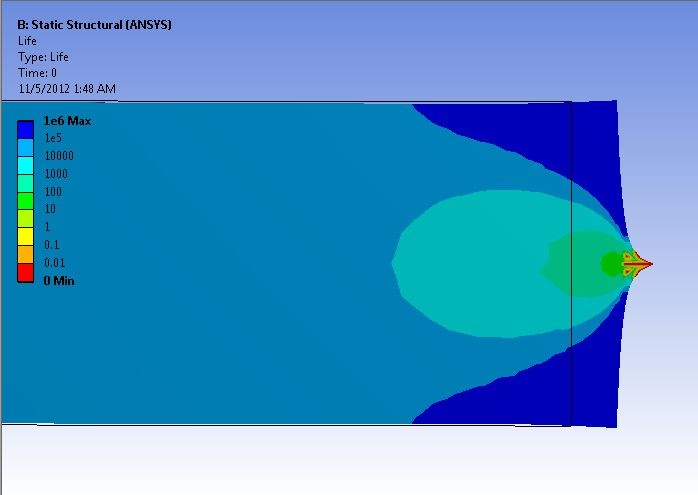
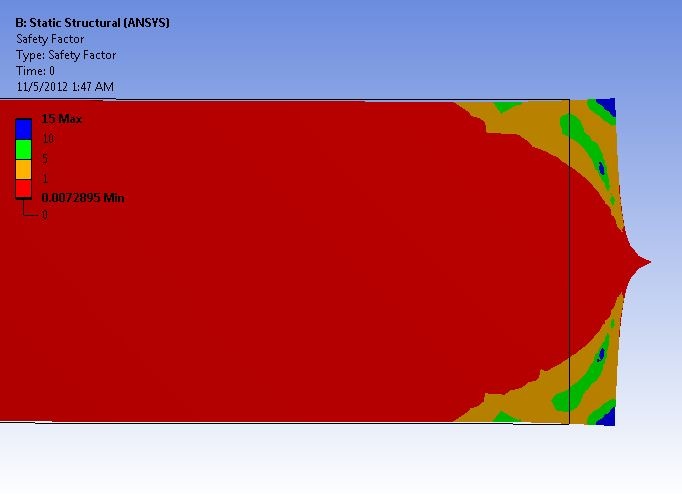
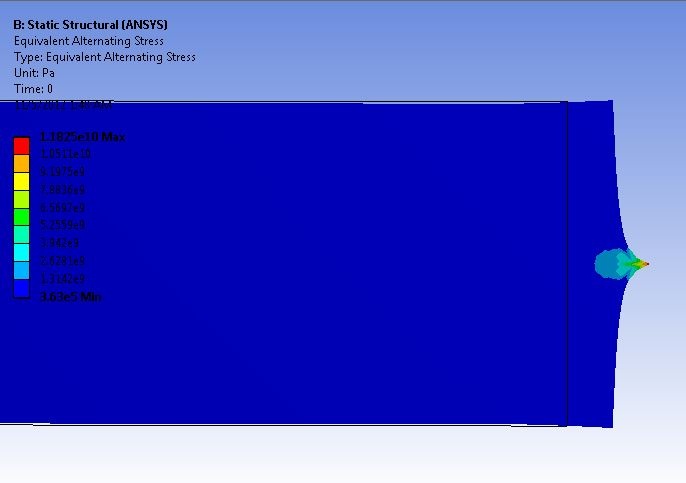
Click on Solve to generate new results. Zoom in on the right side of the bar by right click and drag. The fatigue analysis of a tensile bar subjected to a point load is shown below:
| Note |
|---|
Specifying the loading ratio to get a loading scheme in ANSYSConsider the case where the load varies smoothly between 500N and -1000N on each cycle. You first perform static loading at -1000N. For the fatigue portion, you must specify the loading ratio in the Fatigue tool (under "Loading Type", select "Ratio") to let ANSYS know what your load cycle will be. This is where ANSYS will know the ratio of your loading scheme (which is varying from 500N to -1000N). This value should be set to -0.5. The resulting sinusoidal graph produced on the right, should vary from an amplitude of 1 to -0.5. ANSYS uses the -1000N in the static loading as a starting point. What this means in ANSYS is that the static loading boundary condition of -1000N is going to be applied as the "max" (ie -1000*1 = -1000N) and then for the "min" it will be 500N (ie -1000*-0.5 =500N). |