 Sign-up for free online course on ANSYS simulations!
...
Now, execute the optimization by clicking on Update and click on Optimization from the outline window to view the results. The optimization should yield similar results to the following table.

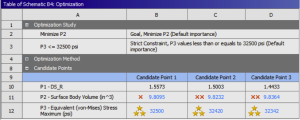
The optimization tool found three candidate points that matched our given constraints and objectives. This computation was pretty fast because the optimization tool used the response surface model (plots) that previously generated. It did not actually solve our model by doing a matrix inversion. Remember that the response surface model is only an approximation of the relationship between the parameters and so our results might not be very accurate. Thankfully, we can solve our model using these candidate points to "verify" that they really do satisfy our constraints.
...