 Sign-up for free online course on ANSYS simulations!
...
The following image shows the graph that ANSYS outputs. The y axis is non-dimensional temperature and the x axis is x position on the line y=1m. 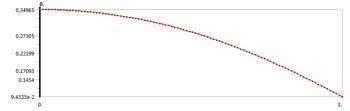
| newwindow | ||||
|---|---|---|---|---|
| ||||
https://confluence.cornell.edu/download/attachments/146918520/PathTempResults_Full.PNG |
Probe Temperature
The following video shows a couple of ways to probe the temperature in the solution domain.
| Widget Connector | ||||||
|---|---|---|---|---|---|---|
|
Directional Heat Flux along Y=0m line
...