 Sign-up for free online course on ANSYS simulations!
| Panel |
|---|
Author: Rajesh Bhaskaran, Cornell University Problem Specification |
Step 6: Plot σx vs. ri , Take 4: Functions
Let's create a function to calculate the bending stress that outputs σx given (M, ri, ro ). Functions are really useful to break down your code into modules and also reuse parts of your code.
Let's first pick MATLAB's brain on how to create functions in MATLAB. Bring up the following page from Documentation.
Home (tab) > Documentation (icon) > MATLAB > Programming Scripts and Functions > Functions > Function Basics > function
Take a couple of minutes to peruse the examples for functions with one output and functions with multiple outputs. MATLAB has extensive documentation on the use of functions; however, one has to poke around a bit before finding the most useful information. I personally go for the examples first.
The correct syntax for creating a function is:
function return_value = function_name(parameter_1, parameter_2,...)
%function description - MUST be in a comment
code...
Tips for MAE 2120 Project 1
Combining Multiple Plots into One Figure
To present results compactly and succinctly, you can combine plots into one figure. For example, shearing force, bending moments and torque plots for a shaft can be presented in the same figure using the subplot function.
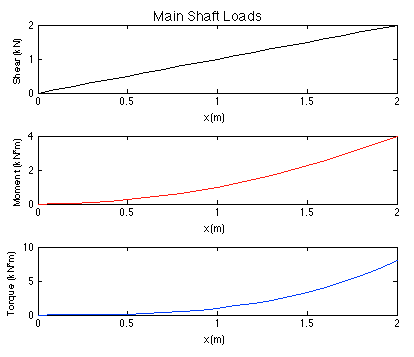
These subplots were generated using the following syntax.
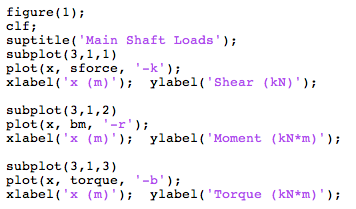
Here is the full script to generate this figure. (Right-click and select save target as, or just left-click and copy-paste into the editor)
For more information on subplots, you can refer yourself to the MATLAB documentation. return_value = value
A few noteworthy points to ponder:
...