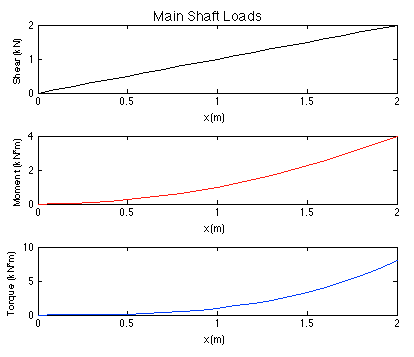
To present results compactly and succinctly, you can combine plots into one figure. For example, shearing force, bending moments and torque plots for a shaft can be presented in the same figure using the subplot function.

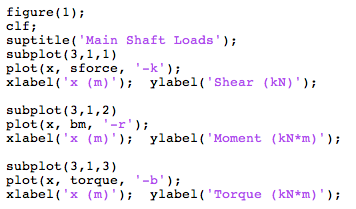
These subplots were generated using the following syntax.

Here is the script to generate this figure. (Right-click and select save target as, or just left-click and copy-paste into the editor)
For more information on subplots, you can refer yourself to the MATLAB documentation.
Use the max function to find the maximum value. For example, to find the maximum value of Bending Moment, use:

Then, the plot function can be used to mark an "x" in the graph to identify the location of this maximum value.

Here is an example script that performs this task. Similarly, you can use the min function to find and mark the minimum value.
The text function can be used to record the maximum or minimum value.
Example:

Here is our example script which also records the max value of Bending Moment.

Go to all MATLAB Learning Modules