 Sign-up for free online course on ANSYS simulations!
...
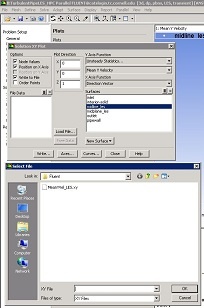
(Click) Plots > XY Plot > Set Up.. as shown in the figure below.
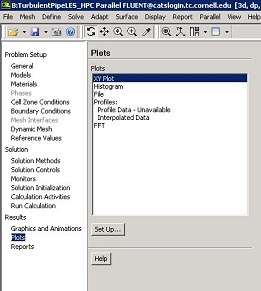
Click Here for Higher Resolution
In the Solution XY Plot window, click on New Surface > Line/Rake... as shown below.
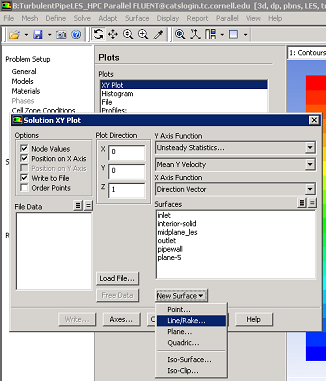
Click Here for Higher Resolution
In the Line/Rake Surface window, under End Points choose (x0 (m), y0 (m), z0 (m)) = (0,0.03175,0) and (x1 (m), y1 (m), z1 (m)) = (0,0.03175,0.00635). Name the surface as midline_les under New Surface Name. Click Create. The line can be viewed using Graphics and Animations > Mesh > Set Up....
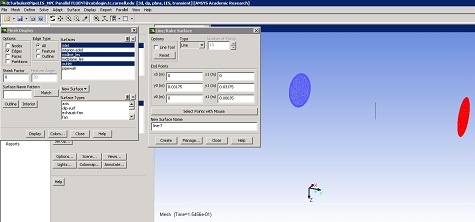
Click Here for Higher Resolution
Go back to Solution XY Plot window and select Unsteady Statistics... and Mean Y Velocity under Y Axis Function and under Plot Direction choose (X,Y,Z) = (0,0,1). Choose midline_les under Surfaces and click Plot. The figure below shows the contour plot of instantaneous axial velocity.
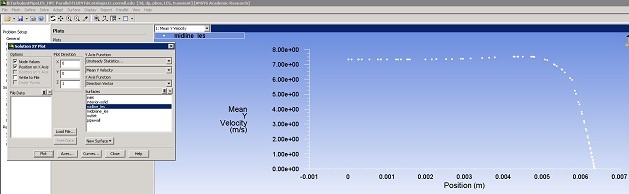
Click Here for Higher Resolution
To save the line plot, select Write to File in the Solution XY Plot window and click Write. Select a location and save the file as MeanYVel_LES.xy.
Click Here for Higher Resolution
...