 Sign-up for free online course on ANSYS simulations!
...
To compare the solution from LES simulation with that from the k-e model, click Load File... in the Solution XY Plot and choose the saved file MeanYVel_LES.xy from the previous section as shown in the figure below. 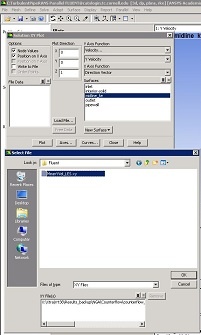
Click Here for Higher Resolution
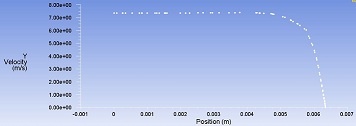
In the Solution XY Plot select Mean Y Velocity under File Data and click Plot. The figure below shows the comparison of the mean Y velocity from k-e and LES simulations, both the results are very close which validates the solution procedure for the LES simulation. 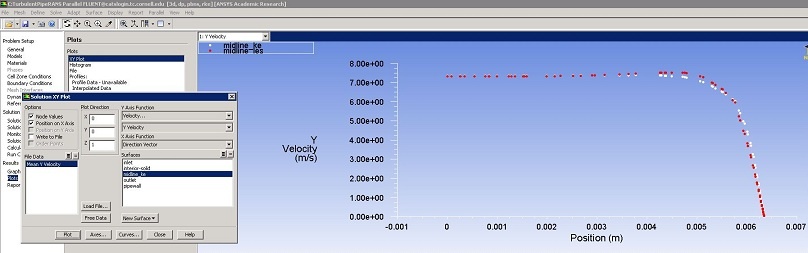
Click Here for Higher Resolution
Go to Problem Specification
Go to all FLUENT Learning Modules