 Sign-up for free online course on ANSYS simulations!
...
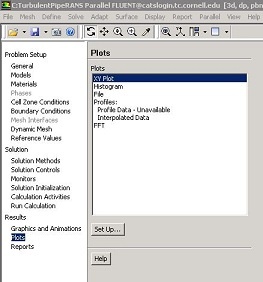
Click on Plots > XY Plot > Set Up... as shown below.
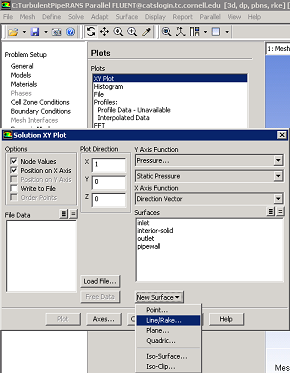
In the Solution XY Plot, choose New Surface > Line/Rake... as shown below.
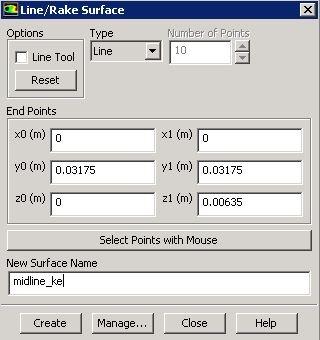
Choose the coordinates of the two points that define the line as below and name the line as midline_ke and click Create and Create Close the window.
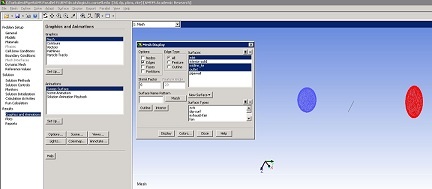
The line can be viewed by clicking Graphics and Animations > Mesh > Set Up....
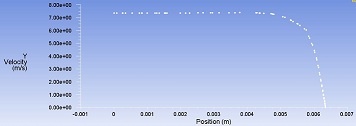
Get Go back to the Solution XY Plot window by clicking Plots > XY Plot > Set Up.... In this window, choose Velocity... and X Y Velocity for Y-Axis Function. Choose Also, choose 0, 0, 1 as the Plot Direction. Finally, choose midline_ke under Surfaces. and click Plot. 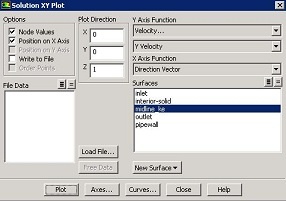 Higher Resolution Image
Go to Problem Specification
Go to all FLUENT Learning Modules