 Sign-up for free online course on ANSYS simulations!
...
In order to verify the LES solution to the turbulent pipe flow problem, we will compare it against the solution obtained using standard k-e model.
Turbulent Pipe with k-e model
In the Workbench Project Page, left-click on the downward pointing arrow on the top-left corner of the TurbulentPipeLES project and select Duplicate from the drop down menu as shown in the figure below.
...
The solution converges in about 600 iterations.
Create Line
Click on Plots > XY Plot > Set Up... as shown below. 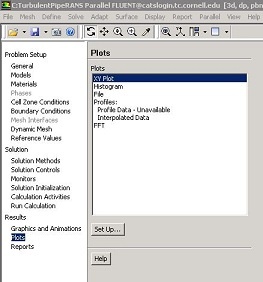 Higher Resolution Image
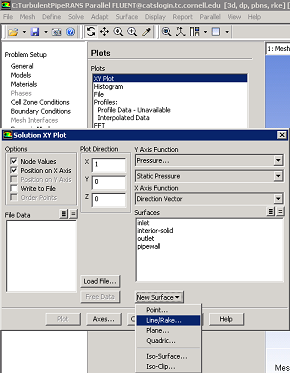
In the Solution XY Plot, choose New Surface > Line/Rake... as shown below.
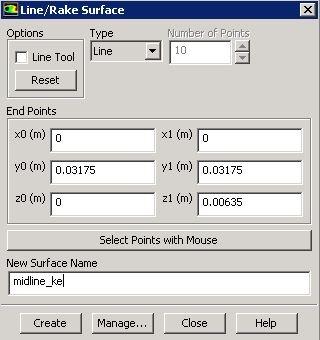
Choose the coordinates of the two points that define the line as below and name the line as midline_ke and click Create and Create the window.
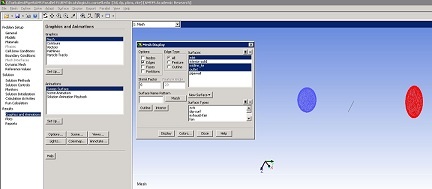
The line can be viewed by clicking Graphics and Animations > Mesh > Set Up....
Get back to the Solution XY Plot window by clicking Plots > XY Plot > Set Up.... In this window, choose Velocity... and X Velocity for Y-Axis Function. Choose midline_ke under Surfaces. and click Plot.
Go to Problem Specification
Go to all FLUENT Learning Modules