 Sign-up for free online course on ANSYS simulations!
...
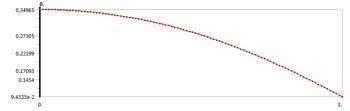
(Click) Solve,  , and ANSYS will find the temperature on the line y=1 m as a function of the distance along the path, which in this case is the x position. ANSYS will obtain the temperature for 100 points on the line y=1m. The data points are displayed in a table and can be exported to a text file or EXCEL file by right-clicking on the table.
You then have the option to export this into a text file or an Excel file. Either will work, but for this tutorial we have exported to excel.
The following image shows the graph that ANSYS outputs. The y axis is non-dimensional temperature and the x axis is x position on the line y=1m.
| newwindow | ||||
|---|---|---|---|---|
| ||||
https://confluence.cornell.edu/download/attachments/146918520/PathTempResults_Full.PNG |
...