 Sign-up for free online course on ANSYS simulations!
...
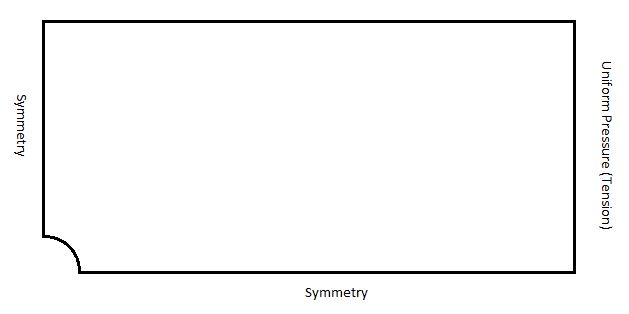
There are a few things we can determine from this picture. Let's use our intuition and the work we did in the pre-analysis to compare to the result ANSYS gives us. First, let's look at the bottom and left edges of the plate. We can see that the deformation on these edges is parallel to the sides, which agrees with the boundary conditions. The top edge of the plate has deformed downwards, which is due to the effects of Poisson's ratio. The right edge has moved to the right, which is consistent with the expected behavior, due to the plate being in tension. Overall, the observed deformations qualitatively agree with what we expect to see from the applied boundary conditions, seen below.
We can also get an idea of how the deformation occurs by pressing Play in the Animation tool bar along the bottom of the screen. To change back to contours, select the Contours button and choose Contour Bands.
...