 Sign-up for free online course on ANSYS simulations!
...
There are a few things we can determine from this picture. Let's use our intuition and the work we did in the pre-analysis to compare to the result ANSYS gives us. First, let's look at the bottom and left edges of the plate. We can see that the deformation on these edges is parallel to the sides, which agrees with the boundary conditions. The top edge of the plate has deformed downwards, which is due to the effects of Poisson's ratio. The right edge has moved to the right, which is consistent with the expected behavior, due to the plate being in tension. We can also get an idea of how the deformation occurs by pressing Play in the Animation tool bar along the bottom of the screen. To change back to contours, select the Contours button and choose Contour Bands.
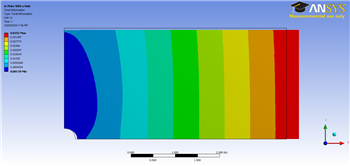
The colored section refers to the magnitude of the deformation (in inches) while the black outline is the undeformed geometry superimposed over the deformed model. The more red a section is, the more it has deformed while the more blue a section is, the less it has deformed. Notice that far from the hole, the deformation is linearly varying, similar as a bar in tension. Now let's look at the value of the largest deformation. Looking at the top of the color bar, we see that the largest deformation is 0.17605 inches. From our pre-analysis, we found that the deformation was 0.1724 inches - a 2% difference. Being that our calculation was only an estimate (we neglected the hole), this seems reasonable.
...