 Sign-up for free online course on ANSYS simulations!
...
Now, let's check the stress at the strain gauge. Click on Solution > StressXX in the Project Outline window. This will bring up the stress distribution over the entire crank.
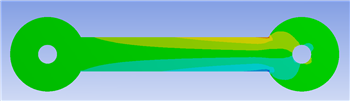
Now, click on the probe tool  Hover the probe tool around where the strain gauge is located. We just want to compare the stresses we see to the calculated value of -1368.65 psi. If you hover the probe around that area, you should find that the stresses are about what we expect them to be based on the calculation. Repeat this step for Solution > StressYY

Here, we assumed that the stress was zero. If we use the probe tool to examine the middle section of the bar, we find that most of the stresses are on the order of 1 x 10^-3, meaning once again the simulation agrees with our calculations.
Continue to Step 7: Verification & Validation
Go to all ANSYS Learning Modules