 Sign-up for free online course on ANSYS simulations!
...
Before we explore the ANSYS results, let's take a peek at the mesh.
Mesh
...
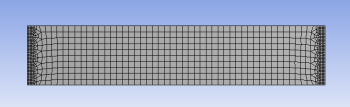
Click on Mesh (above Solution) in the tree outline.This shows the mesh used to generate the ANSYS solution. The domain is a rectangle. This domain is discretized into a number of small "elements". For each element, ANSYS approximates how the structure responds to the forces acting on the element. A finer mesh is used in areas of greater stress concentration. We have checked that the solution presented to you is reasonably independent of the mesh.
Displacement:
To view the deformed structure, click on Solution > Displacement in the tree outline. The black rectangle shows the undeformed structure. The deformed structure is colored by the magnitude of the displacement. Red areas have deformed more and blue areas less. You can see that the left end has not moved as specified in the problem statement. This means this boundary condition has been applied correctly. The displacement increases from left to right as we intuitively expect. There is also not much variation in the y-direction. Note the extremely high deformation near the point load. This extremum is unrealistic and should be ignored (there are no point loads in reality).
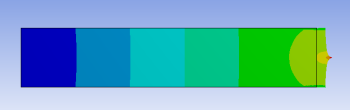
Please note that the displacement throughout the bar is not uniform. There is no displacement at the end attached to the wall and the displacement increases until the maximum at the point load as we move along the bar.
Sigma_x:
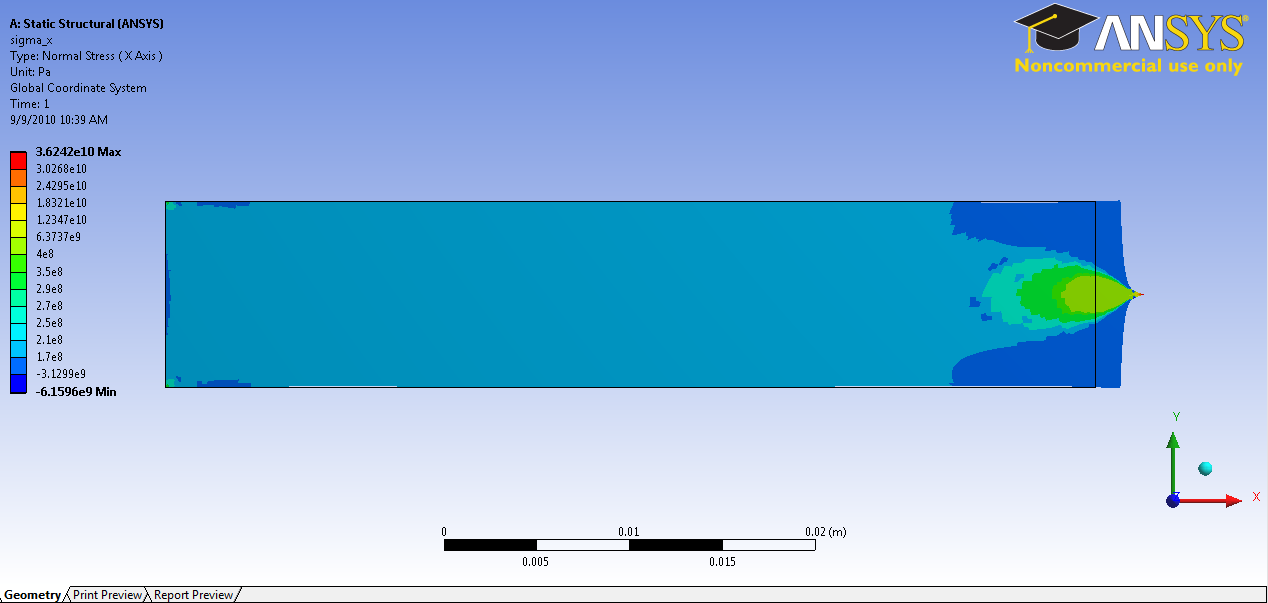
Note here that the stress in x direction is not constant as assumed in the analytical method. If we were to pick a section near the middle of the bar, our analytical result would be nearly accurate. The solution, however, no longer applies when considering the stresses at the wall, and the stresses near the point load. Obviously, the stresses in the x-direction maximizes at the point load.
...