 Sign-up for free online course on ANSYS simulations!
...
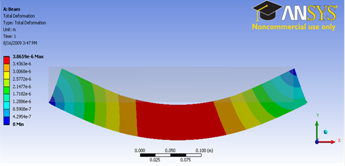
Let first look at Total Deformation. Under Solution (F6A6), click on Total Deformation. The Total Deformation plot is then shown in the Graphics window. The maximum deflection is 0.026644 in. We should check that our results make sense. It appears that the boundary conditions have been satisfied as the tip of the shaft moves downward and the hole at the other end of the crank is held in place.
...
You can also animate the deformation by clicking play button right under Graphics window.
Bending Stress
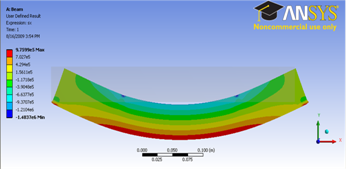
Now let's look at the stress on the crank. Left clicking on User Defined Result under Solution (A6). In the Graphics window show the crank stress contour.
| newwindow | ||||
|---|---|---|---|---|
| ||||
https://confluence.cornell.edu/download/attachments/112040800/Bending%20Stress.png |
We expect a pure bending stress in the central region between the two applied forces. The stress is tensile on the bottom surface and compressive on the top surface as expected. Elementary beam theory predicts the bending stress as σxx =My/I. Here
M = 4000*0.1 = 400 N m
I =bh3/12 =(1)*(0.05)3/12 = 1.04e-5 m4 (assuming unit thickness in the z direction)
For this geometry, we expect the neutral axis to be at y =h/2 =0.025 m. So the max value of σxx= M*(h/2)/I = 9.6e5 Pa. This is reasonably close to both the maximum value of tensile and compressive stresses from the computational solution. We have a relatively stubby beam; the agreement with beam theory should improve as the length/height ratio of the beam is increased. Also, the FEA solution perhaps can be made more accurate by refining the mesh. This is left as an exercise to the reader.
Go to Step 7: Verification & Validation
...