 Sign-up for free online course on ANSYS simulations!
...
Try copy the appropriate data sets to excel and plot the results.
Mach Number Plot
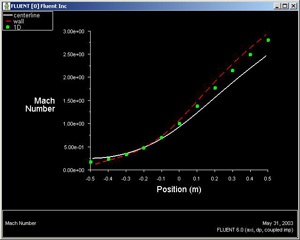
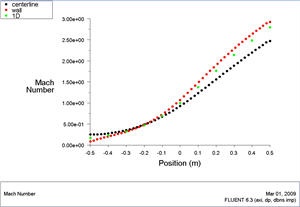
As in the previous tutorials, we are going to plot the velocity along the centerline. However, this time, we are going to use the dimensionless Mach quantity.
Plot > XY Plot
We are going Let's plot the variation of the Mach number in the axial direction at the axis and wall. In addition, we will plot the corresponding variation from 1D theory. You can download the file here: mach_1D.xy.Do everything as we would do for plotting the centerline velocity. However, instead of selecting Axial Velocity as Plot > XY PlotUnder the Y Axis Function, select Velocity... and Mach Number.
Also, since we are going to plot this number at both the wall and axis, select centerline and wall under Surfaces.
Then, load the mach_1D.xy by clicking on Load File.... 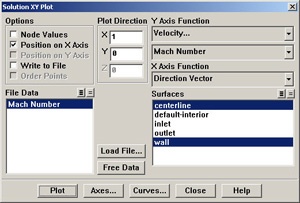
(Click picture for large image) 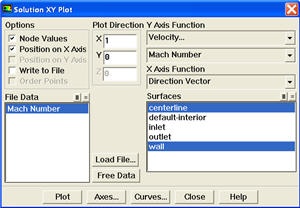
(Click picture for large image)
How does the FLUENT solution compare with the 1D solution?
...