 Sign-up for free online course on ANSYS simulations!
...
As we can see, the temperature decreases from left to right in the nozzle, indicating a transfer of internal energy to kinetic energy as the fluid speeds up.
Total Temperature Contour Plot
Let's look at the total pressure in the nozzle
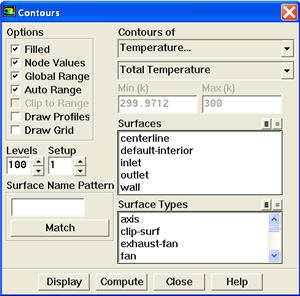
Display > Contours...
Select Temperature... and Total Temperature under Contours of. Select Filled. Use Levels of 100.
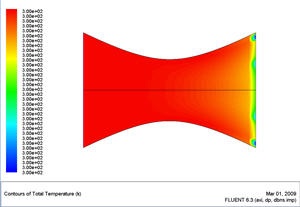
We see that the total temperature is uniform throughout the nozzle by looking at the scale. The contour abnormality at the outlet of the nozzle is due to the round off errors.
Mach Number Plot
As in the previous tutorials, we are going to plot the velocity along the centerline. However, this time, we are going to use the dimensionless Mach quantity.
...
Try copy the appropriate data sets to excel and plot the results.
Temperature Contour Plot
Now we will plot the temperature contours and see how the temperature varies throughout the nozzle.
Back in the Contours window, under Contours Of, select Temperature... and Static Temperature.
Click Display.
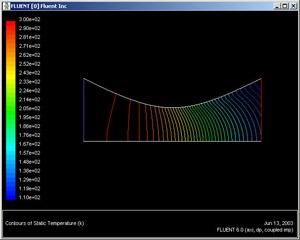
(Click picture for large image)
As we can see, the temperature decreases towards the right side of the nozzle, indicating a change of internal energy to kinetic energy as the fluid speeds up.
Go to Step 7: Refine Mesh
See and rate the complete Learning Module
...