 Sign-up for free online course on ANSYS simulations!
...
Around the nozzle outlet, we see that there is a pressure loss because of the numerical dissipation.
Temperature Contour Plot
Let's investigate or verify the temperature properties in the nozzle.
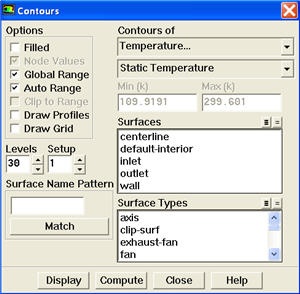
Display > Contours...
Select Temperature... and Static Temperature under Contours of. Use Levels of 30.
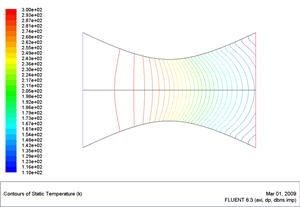
As we can see, the temperature decreases from left to right in the nozzle, indicating a transfer of internal energy to kinetic energy as the fluid speeds up.
Mach Number Plot
As in the previous tutorials, we are going to plot the velocity along the centerline. However, this time, we are going to use the dimensionless Mach quantity.
...
Try copy the appropriate data sets to excel and plot the results.
Temperature Contour Plot
Now we will plot the temperature contours and see how the temperature varies throughout the nozzle.
...