 Sign-up for free online course on ANSYS simulations!
...
Do note that 1D approximation is fairly accurate around the centerline of nozzle.
Pressure Contour Plot
Let's look at how pressure changes in the nozzle.
Display > Contours...
Select Pressure... and Static Pressure under Contours of. Use Levels of 30
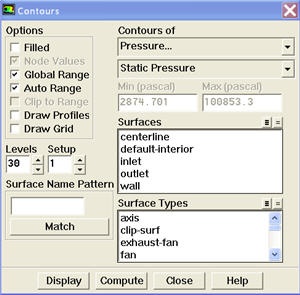
Click Display.
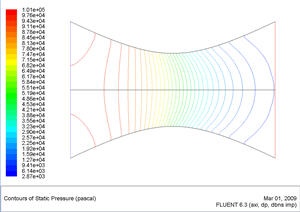
Notice that the pressure decreases as it flows to the right
Mach Number Plot
As in the previous tutorials, we are going to plot the velocity along the centerline. However, this time, we are going to use the dimensionless Mach quantity.
...
Save this plot as machplot.xy by checking Write to File and clicking Write....
Pressure Contour Plot
Sometimes, it is very useful to see how the pressure and temperature changes throughout the object. This can be done via contour plots.
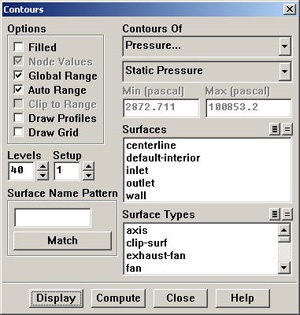
Display > Contours...
First, we are going to plot the pressure contours of the nozzle. Therefore, make sure that under Contours Of, Pressure... and Static Pressure is selected.
We want this at a fine enough granularity so that we can see the pressure changes clearly. Under Levels, change the default 20 to 40. This increases the number of lines in the contour plot so that we can get a more accurate result.
Click Display.
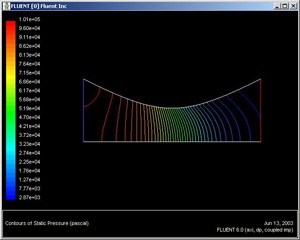
(Click picture for large image)
Notice that the pressure on the fluid gets smaller as it flows to the right, as is consistent with fluid going through a nozzle.
Pressure Plot
Let's look at the pressure along the centerline and the wall.
...