 Sign-up for free online course on ANSYS simulations!
...
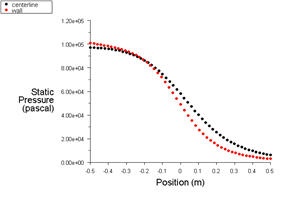
Let's look at the pressure along the centerline and the wall. 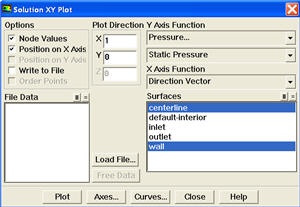
Plot > XY Plot
Make sure that under Y-Axis Function, you see Pressure... and Static Pressure. Under Surfaces, select centerline and wall. Click Plot.
It is good to write the data into a file to have greater flexibility on how to present the result in the report. At the same XY Plot windows, select Write to File. Then click Write... Name the file "p.xy" in the directory that you prefer.
Open "p.xy" file with notepad or other word processing software. At the top, we see:
...
| No Format |
|---|
((xy/key/label "centerline") -0.5 97015.3 -0.48 96949.9 . . . 0.5 6012.92 ) ((xy/key/label "wall") -0.5 100853 -0.480911 100496 . . . 0.5 2874.7 ) |
...