 Sign-up for free online course on ANSYS simulations!
...
Because the cylinder is symmetry in shape, we see that the pressure coefficient profile is symmetry between the top and bottom of cylinder.
Plot Stream Function
LetNow, let's take a look at the Pressure Coefficient variation around the cylinderStream Function.
Display > Contours
Under Contours of, choose Velocity.. and Stream Function. Deselect the Filled option. Click Display.
...
Enclosed streamlines at the back of cylinder clearly shows the recirculation region.
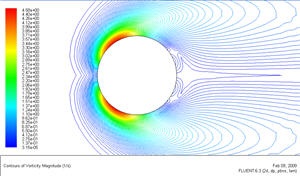
Plot Vorticity Magnitude
Let's take a look at the Pressure Coefficient variation around the cylinder. Vorticity is a measure of the rate of rotation in a fluid.
Display > Contours
Under Contours of, choose Velocity.. and Vorticity Magnitude. Deselect the Filled option. Click Display.
Go to Step 7: Verify ResultsRefine Mesh
See and rate the complete Learning Module
...