 Sign-up for free online course on ANSYS simulations!
...
Let's take a look at the Pressure Coefficient variation around the cylinder.
Display > Contours
Under Contours of, choose Pressure.. and Pressure Coefficient. Select the Filled option. Increase the number of contour levels plotted: set Levels to 100.
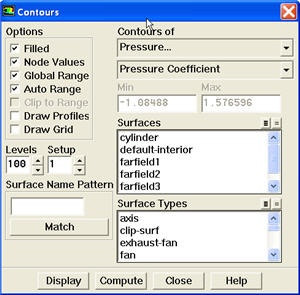
Click Display.
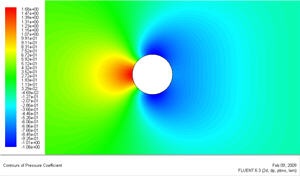
Because the cylinder is cylindrical, we see that the pressure coefficient profile is symmetry between the top and bottom of cylinder.
...
Let's take a look at the Pressure Coefficient variation around the cylinder.
Display > Contours
Under Contours of, choose Pressure.. and Pressure Coefficient. Select the Filled option. Increase the number of contour levels plotted: set Levels to 100.
Click Display.
Because the cylinder is cylindrical, we see that the pressure coefficient profile is symmetry between the top and bottom of cylinder
...