 Sign-up for free online course on ANSYS simulations!
...
Use the default setting by clicking Display.
 !step6_clip_velocityvectorsm.jpg
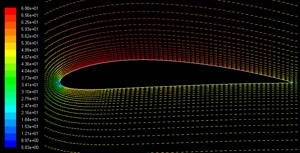
(Click picture for larger image)
As can be seen, the velocity of the upper airfoil is faster than the velocity on the lower airfoil.
!step6_clip_image005_0000sm.jpg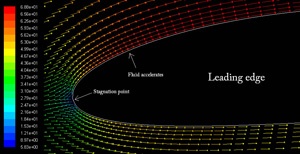
(Click picture for larger image)
On the leading edge, we see a stagnation point where the velocity of the flow is nearly zero. The fluid accelerates on the upper surface as can be seen from the change in colors of the vectors.
 !step6_clip_image006_0000sm.jpg
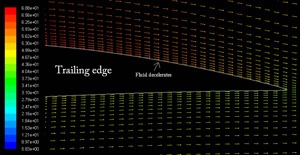
(Click picture for larger image)
...
Change the Y Axis Function to Pressure..., followed by Pressure Coefficient. Then, select airfoil under Surfaces.
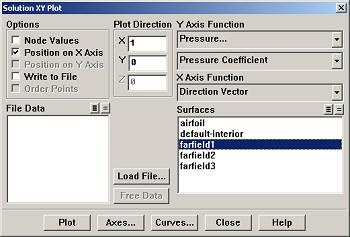
Click Plot.!step6_pressuresm.jpg
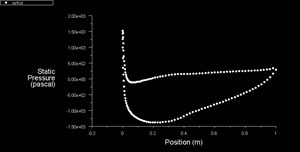
(Click picture for larger image)
...
Select Pressure... and Static Pressure from under Contours Of. Click Display. Check also the Filled and Draw Grid under Options menu.
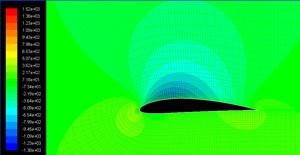
(Click picture for larger image)
...