 Sign-up for free online course on ANSYS simulations!
| Include Page | ||||
|---|---|---|---|---|
|
Step 6: Results
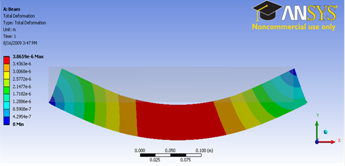
Total Deformation
Let first look at Total Deformation. Under Solution (A6), click on Total Deformation. The Total Deformation plot is then shown in the Graphics window. The maximum deflection is 0.026644 in. We should check that our results make sense. It appears that the boundary conditions have been satisfied as the tip of the shaft moves downward and the hole at the other end of the crank is held in place.
| newwindow | ||||
|---|---|---|---|---|
| ||||
https://confluence.cornell.edu/download/attachments/112040800/Deformation.png |
Note: To show the original undeformed crankbeam, go to third menu click  and click on
...
You can also animate the deformation by clicking play button right under Graphics window.
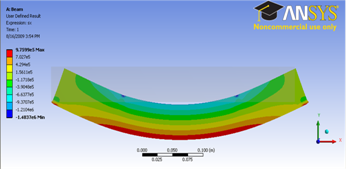
Bending Stress
Now let's look at the stress on the crankbeam. Left clicking on User Defined Result under Solution (A6). In the Graphics window show the crank stress contour.
...
Note: We see stress concentration appears around the region of the point force and point displacement. A force and displacement applied to a vertex is not realistic and loads to singular stresses (that is , stresses that approach infinity near the loaded vertex). We should disregard stress values in the vicinity of the loaded points.
Go to Step 7: Verification & Validation