 Sign-up for free online course on ANSYS simulations!
...
Now, click Plot. The plot of the axial velocity as a function of distance along the centerline now appears.
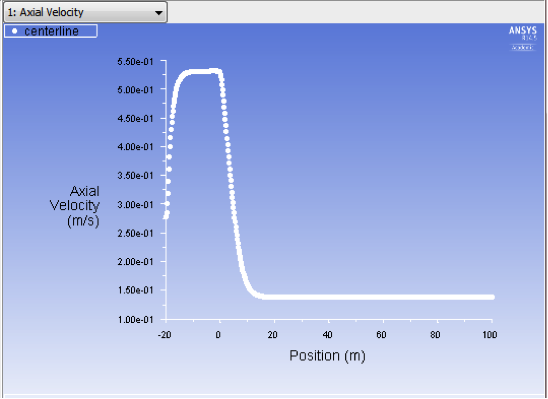
In the graph that comes up, we can see that the velocity reaches a constant value (about 5.25e-1 m/s) beyond a certain distance from the inlet. This is the fully-developed flow region in the small pipe. When the flow pass the expansion entrance at x=0 m, the velocity will decrease due to the sudden expansion of the pipe. After another development, the velocity will reach a constant value (about 1.5e-1m/s) again.
...