Resources for Creating and Posting Professional-Looking Graphs and Tables
Also check out the Grammar Guidelines for Reports for a simple table of common errors!
Figure Creation and Formatting
Presenting data in an understandable format requires thought and attention to detail. Follow these guidelines when preparing graphs for lab reports and presentations.
Formatting Figures
- Use a white background for all graphs.
- Most data will have both x and y values and thus should be presented using an xy scatter plot.
- Label all axes and include units where appropriate.
- Axis scale labels should be in the margin of the graph and not inside the graph border.
- Eliminate parts of the range in both x and y axis that aren't used or that aren't meaningful.
- Place a caption with a brief description below the graph. Add this caption using the wiki formatting, not in your graphing software.
- Use data symbols to show data points unless there is so much data that the symbols overlap. If the data symbols overlap it is better to connect the data points with a line and not show the data symbols.
- When presenting multiple plots on a single graph make sure that it is easy to distinguish the plots using the legend.
- If curve fitting is used explain why and include the equation (elsewhere in the report).
- If a model or theoretical curve is presented it should be a smooth curve without data points.
- Use the same font in the graphs as you use in the text of the report.
- Insert the graph in your report after the first reference to it in the text. Inserted the graph after the next paragraph break
- Scale the size of the graph so it is large enough to see the data and read the text without having to follow a link to see a larger image. Avoid using hyperlinks on images because that causes the export to Microsoft Word option to not include the image.
How to Include Graphs from MathCAD
- Select the graph in MathCAD by dragging a box with your mouse over the
graph. This prevents the graph from going into edit mode and losing
the formatting! - Copy the graph from MathCAD
- Paste it into PowerPoint
- Right click on the graph and select Save as picture.
- Select the png option for the file type and give the file a descriptive name
- Upload the file into the page that you want to post the graph on.
How to Include Graphs from Excel
- Eliminate border from graph, change background to white, etc. (follow the Figure guidelines above!)
- Copy the graph from Excel
- Paste it into PowerPoint
- Right click on the graph and select Save as picture.
- Select the png option for the file type and give the file a descriptive name
- Upload the file into the page that you want to post the graph on.
Captioning Figures, an example
Unknown macro: {float}
Unable to render embedded object: File (stampbox.jpg) not found.
Basic Stamp® microprocessor control box with ports for 6 on/off devices and 6 variable speed peristaltic pumps.
An #output control box designed and fabricated around the Basic Stamp® Microprocessors (Parallax 16 port BS2sx and 40 port BS2p BASIC Stamp® modules) is used for on/off control of up to six devices and for variable control of up to six peristaltic pumps.
The float macro keeps the graphic and the caption together and floats the figure on the page with text wrapping around it automatically. Because the top of the figure will align with the text that the float is above, I recommend inserting the figure wrapped in the float macro immediately above the paragraph where the first reference to the figure occurs. This will place the figure along side the paragraph with the reference. Use anchors to refer to the figure just like you would use "Figure 11" references in a conventional manuscript. There is no way to implement auto numbering of the Figures so for now don't even bother to use numbers in the Figure. Instead, in the body of the report where you first reference the #output control box add an anchor link that connects to the Figure. Use heading 5 for table and figure captions. This makes it possible to generate a list of tables and figures. Note that there is no numbered Figure reference in the caption. Also note that the image is a hyperlink to the full size original image. If the image is from a different source file the hyperlink should be to the original source file such as a MathCAD or Excel sheet.
In this example I set the size of the float and the size of the image to 200px. The viewer can see the full image by clicking on it.
Creating Graphs in the Wiki
Save the data as an excel spreadsheet containing only the data that you actually want to graph. For info on the parameters see the chart userguide.
Using Images
Do not use poor quality images. Images are used to convey ideas, so they should be clear, legible and descriptive. You should update them until they look good enough to present in a paper. Some useful guidelines:
- Save all images as .png instead of .jpg
- Copy images into powerpoint instead of paint. They will be better quality. Save them as a png file.
- For AutoCAD drawings: Use the command plot. Then select PublishToWeb PNG. Choose a large enough paper size that your drawing looks clear and not fuzzy.
Working With Tables, an example
Tables do not convey trends nearly as well as graphs. They should only be used to display information that is not meant to be on a graph. Tables should be created using the following format. You should not use images of tables.
Unknown macro: {float}
Wiring standard used for combining power supplies and analog data acquisition in a Category 5 Ethernet cable.
T-568B standard |
T-568A standard |
voltage |
|---|---|---|
white/orange |
white/green |
S- |
orange |
green |
S+ |
white/green |
white/orange |
ground |
blue |
blue |
-5 V |
white/blue |
white/blue |
+5 V |
green |
orange |
+10V |
white/brown |
white/brown |
-15 V |
brown |
brown |
+15 V |
Here is an example table. This is a relatively complex example because when you go to edit this page, you will see that the simple table code is included in a "float" command. Here I refer to the table by creating an internal link (an anchor) that will take the viewer to the top of the table. For example here I am talking about the #analog wiring standard that we use in the AguaClara laboratory. Note that I position the floating table above the paragraph where it is first referenced so that it appears along the side of that paragraph. I haven't figured out an automatic way to set the width of the table. Currently I am doing it by trial and error. If someone figures out a better way, please edit this!
To create a simple table, you just need a series of vertical slashes in rows-- two slashes makes a header cell, and one slash makes a regular cell.
This code:
|| column 1 || column 2 || column 3 ||
| item 1 | item 2 | item 3 |
Produces this table:
column 1 |
column 2 |
column 3 |
|---|---|---|
item 1 |
item 2 |
item 3 |
When you are creating tables:
- Never put in a picture of a table, create a table using this wiki coding and always show all equations used to calculate any values in your table
- Attach the source file! If you did a bunch of calculations in an Excel file, make sure to create a wiki table showing those results, and then attach the original Excel file with all your calculations. Create a link on the wiki to that attached file.
Adding Equations
All equations should be added using MathType. Do not simply type in an equation to the wiki.
Unknown macro: {float}

- The first time you use MathType to create LaTEX code you need to do the following steps
- In the Mathtype window click the preferences tab and then at the top click translators
- click the dot by Translate to other languages and in the pull down box select "TeX-Plain TeX" make sure to uncheck the two boxes at the bottom. This allows you to paste equations into the wiki.
- Click ok.
- Create the equation, or open a previously created equation from a file.
- Highlight the entire equation in the Mathtype window and copy it.
- Make sure you are working in the 'Wiki Markup' editor, and not 'Rich Text'.
- type or copy the code below and paste it into your document. Paste your equation in the area that says 'paste equation here.'
{latex}
\large
paste your equation here
{latex}
For example:
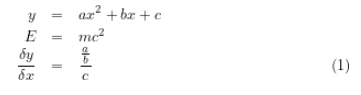
Congratulations, you have created an equation.