| Name
|
Size
|
Creator |
Creation Date
|
Last Modification Date
|
Labels |
Attached To |
|
Microsoft Excel Sheet Designvalues.xls |
6 kB |
Anonymous |
May 06, 2009 17:15 |
May 06, 2009 17:15 |
|
: Atima
|
|
File FlocTank.txt |
11 kB |
Anonymous |
May 06, 2009 17:15 |
May 06, 2009 17:15 |
|
: Cuatro Comunidades
|
|
File projectinfo.acd |
0.2 kB |
Anonymous |
May 06, 2009 17:15 |
May 06, 2009 17:15 |
|
: Cuatro Comunidades
|
|
Microsoft Excel Sheet Designvalues.xls |
6 kB |
Anonymous |
May 06, 2009 17:15 |
May 06, 2009 17:15 |
|
: Cuatro Comunidades
|
|
File Atima.dwg |
2.34 MB |
Anonymous |
May 06, 2009 17:15 |
May 06, 2009 17:15 |
|
: Atima
|
|
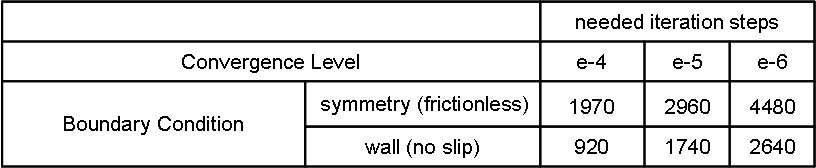
PNG File sensitivity analysis - iteration table.png |
5 kB |
user-c73ee |
May 06, 2009 16:52 |
May 06, 2009 16:52 |
|
Page: performance parameters analysis in 2D - sensitivity analysis
|
|
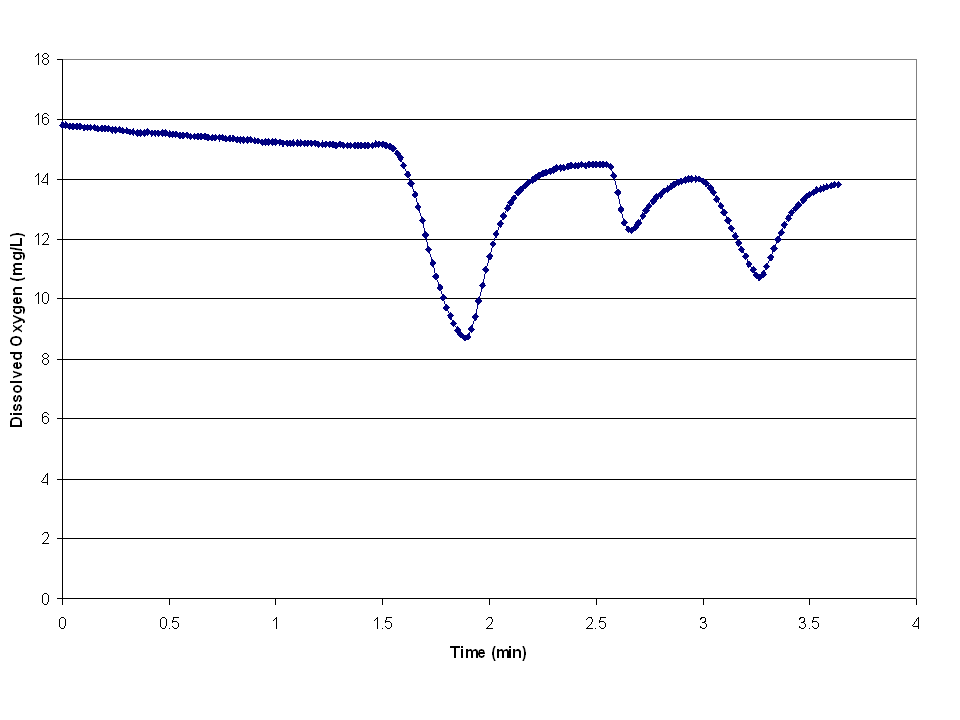
PNG File bubbles neg pressure system DO.png |
12 kB |
user-c501f |
May 06, 2009 16:40 |
May 06, 2009 16:40 |
|
Page: DO Removal by Partial Vacuum and Aeration
|
|
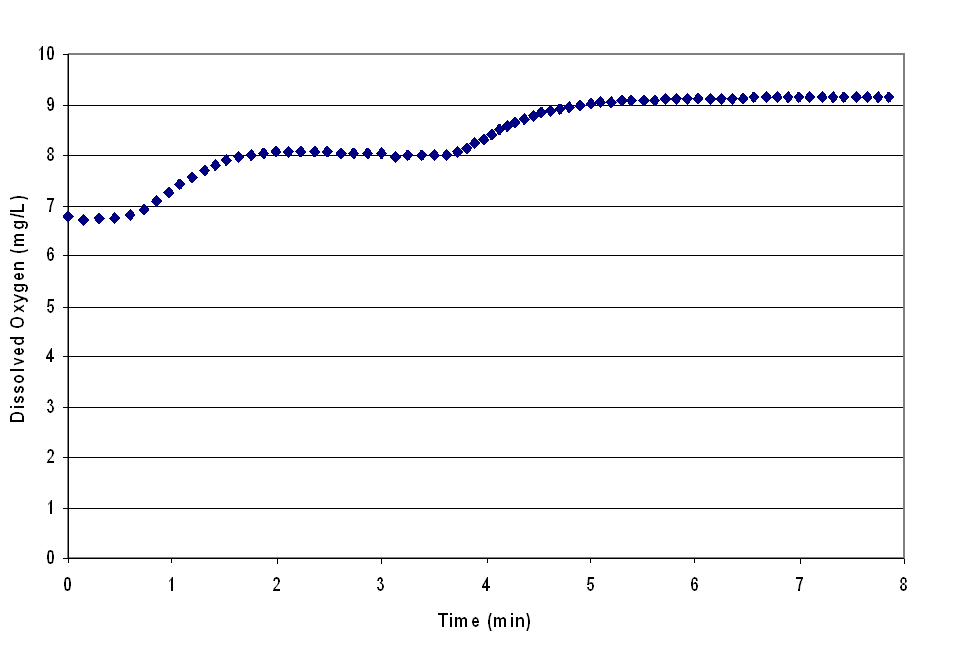
PNG File bubbles open system DO.png |
11 kB |
user-c501f |
May 06, 2009 16:40 |
May 06, 2009 16:40 |
|
Page: DO Removal by Partial Vacuum and Aeration
|
|
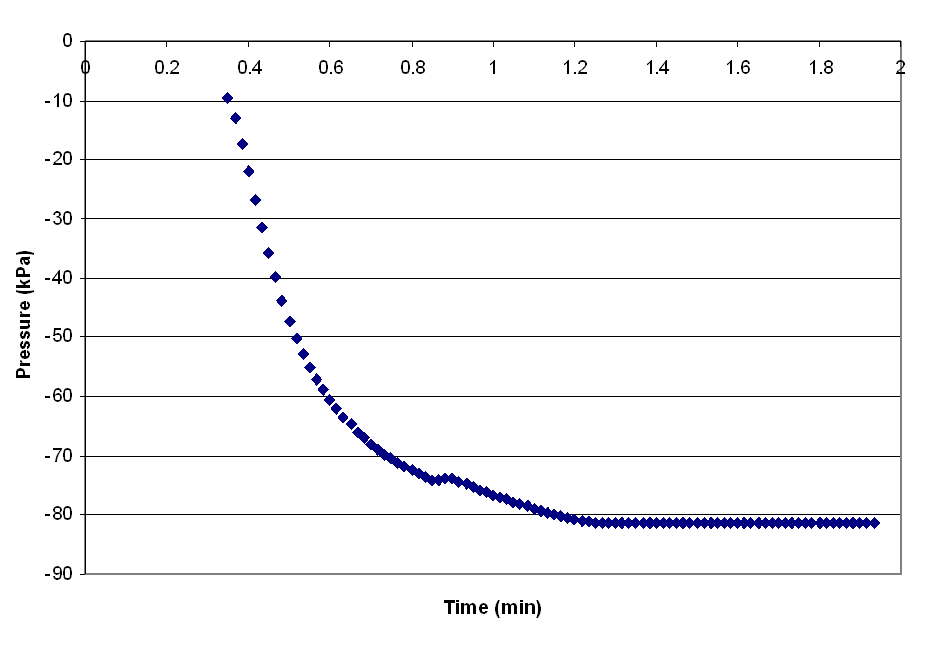
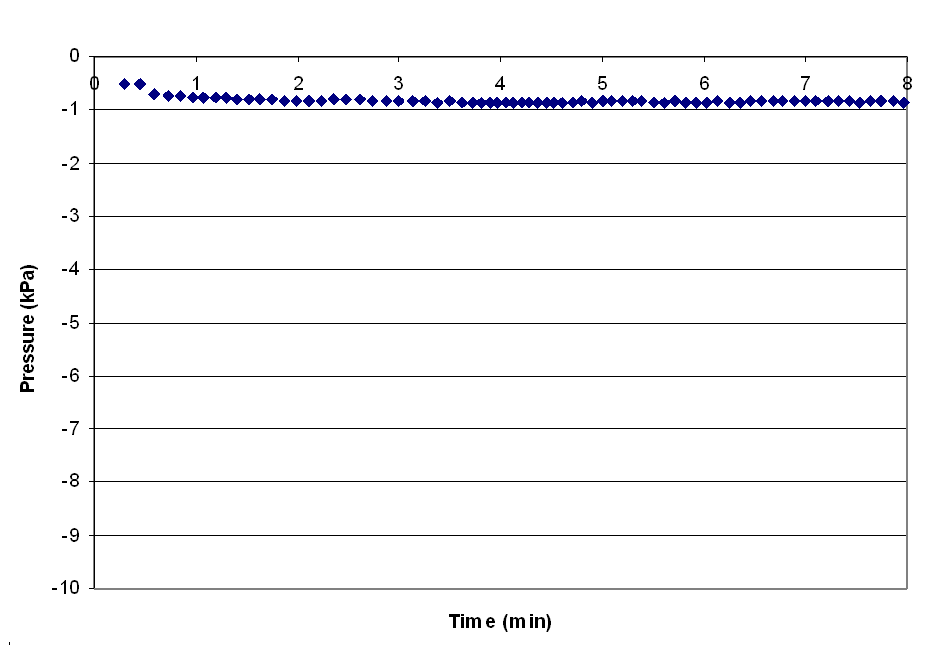
PNG File bubbles closed system pressure -.png |
12 kB |
user-c501f |
May 06, 2009 16:40 |
May 06, 2009 16:40 |
|
Page: DO Removal by Partial Vacuum and Aeration
|
|
PNG File bubbles open system pressure -.png |
10 kB |
user-c501f |
May 06, 2009 16:40 |
May 06, 2009 16:40 |
|
Page: DO Removal by Partial Vacuum and Aeration
|
|
JPEG File AGUACLARA_HEADER2.jpg |
92 kB |
user-b26af |
Apr 24, 2009 02:56 |
May 06, 2009 16:22 |
|
Page: Potential Journal Submissions
|
|
Microsoft Excel Sheet further simulation experiments.xls |
2.26 MB |
user-c73ee |
May 06, 2009 16:20 |
May 06, 2009 16:20 |
|
Page: performance parameters analysis in 2D - sensitivity analysis
|
|
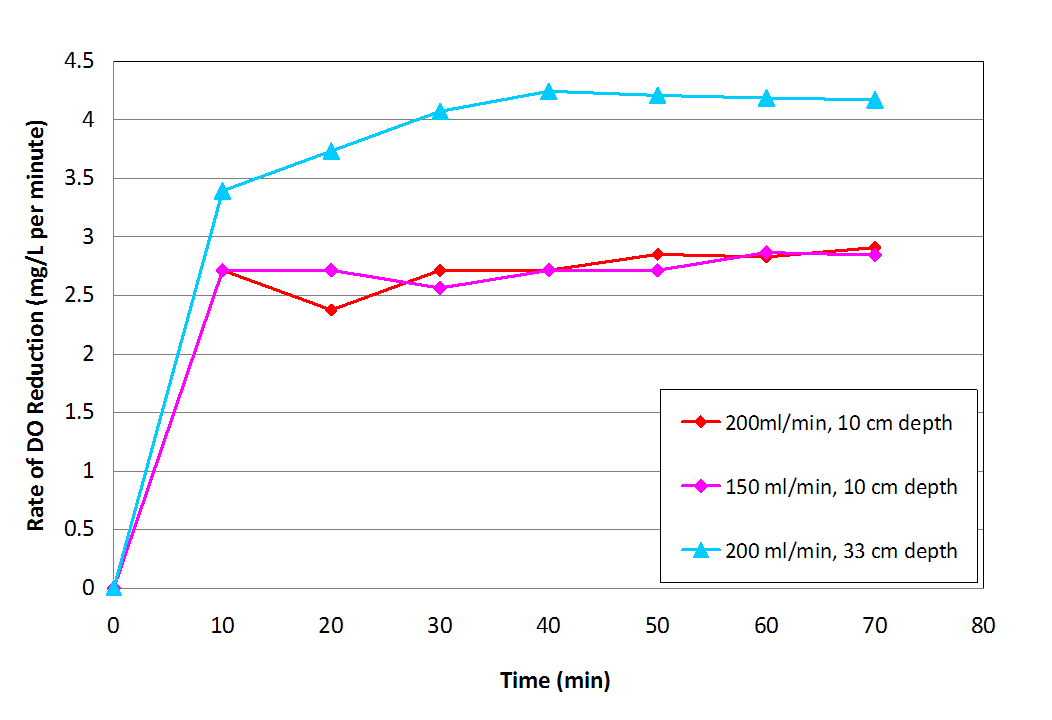
PNG File Fig.5, DO red. rate vs. time, no outlier.png |
12 kB |
user-f9f3e |
May 06, 2009 13:16 |
May 06, 2009 14:47 |
|
Page: Bubble Volume Measurement Method Development
|
|
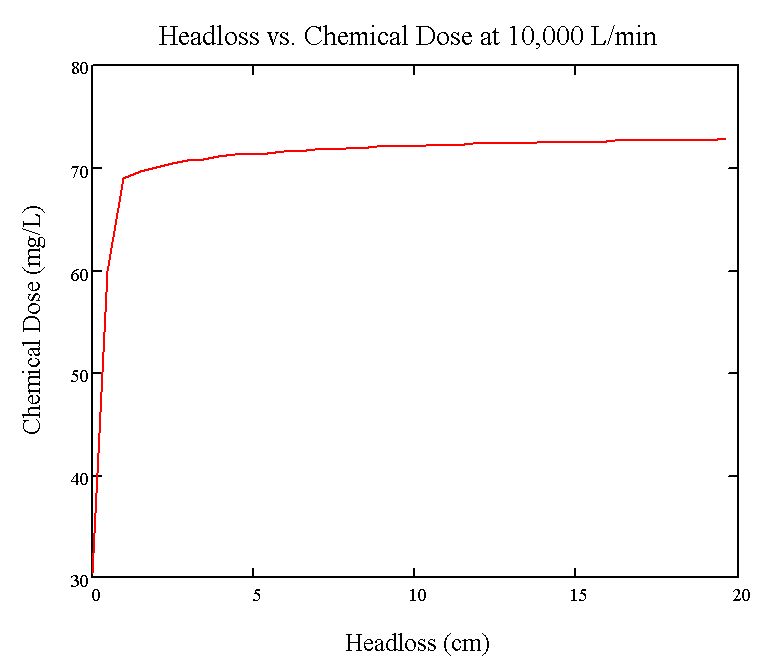
PNG File chemicaldose.png |
3 kB |
user-9c3bf |
May 06, 2009 14:40 |
May 06, 2009 14:40 |
|
Page: Nonlinear Chemical Dose Controller Fall08-Summer09
|
|
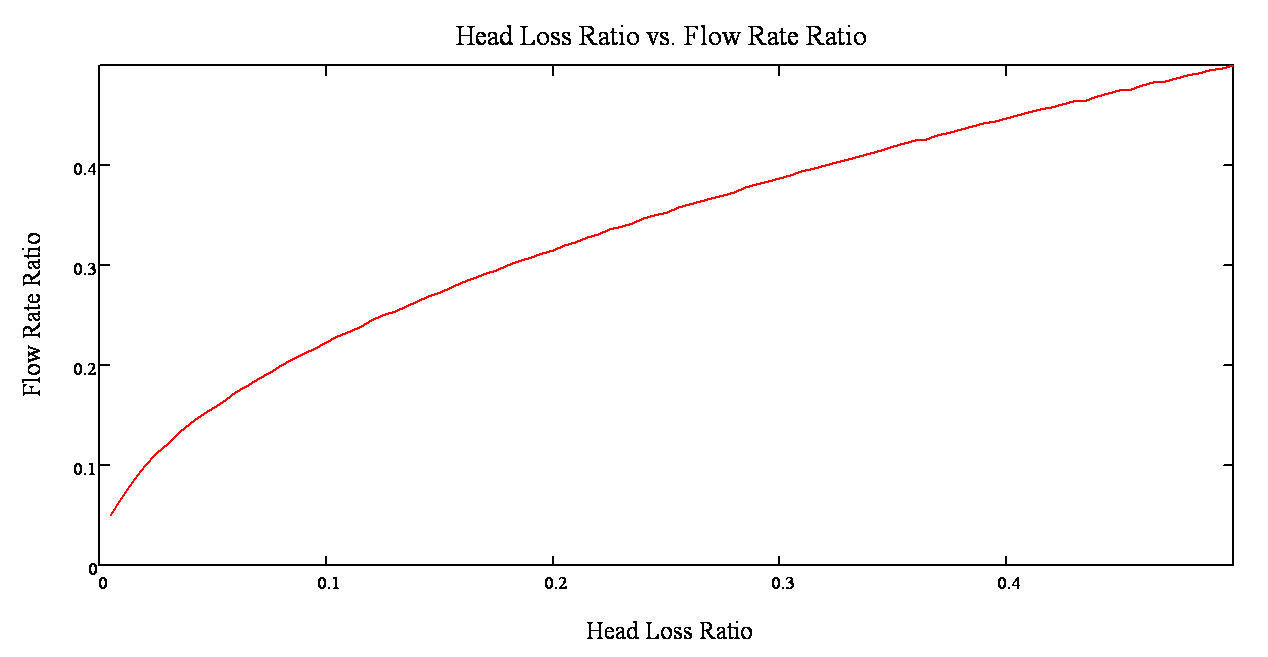
PNG File Head Loss Ratio vs Flow Rate Ratio Graph.png |
6 kB |
user-6a86a |
May 06, 2009 13:44 |
May 06, 2009 13:44 |
|
Page: Rapid Mix Chamber Design Program
|
|
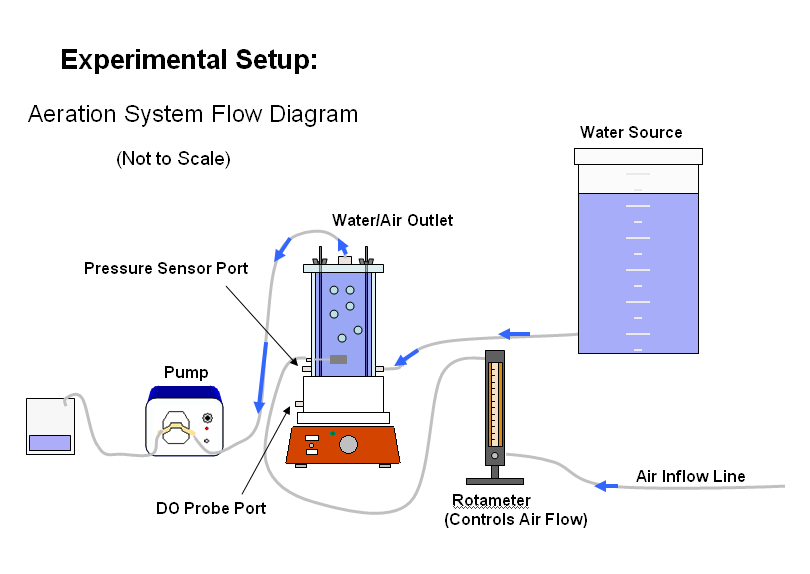
PNG File AerationDiagram.PNG |
36 kB |
user-c501f |
May 06, 2009 13:18 |
May 06, 2009 13:18 |
|
Page: Aeration Flow Diagram
|
|
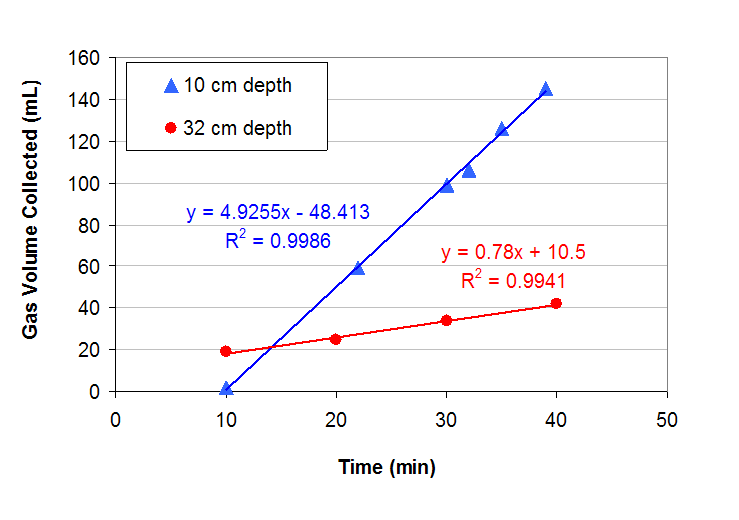
PNG File Fig.2, vol vs. time, 2 depths.png |
8 kB |
user-f9f3e |
May 06, 2009 13:16 |
May 06, 2009 13:16 |
|
Page: Bubble Volume Measurement Method Development
|
|
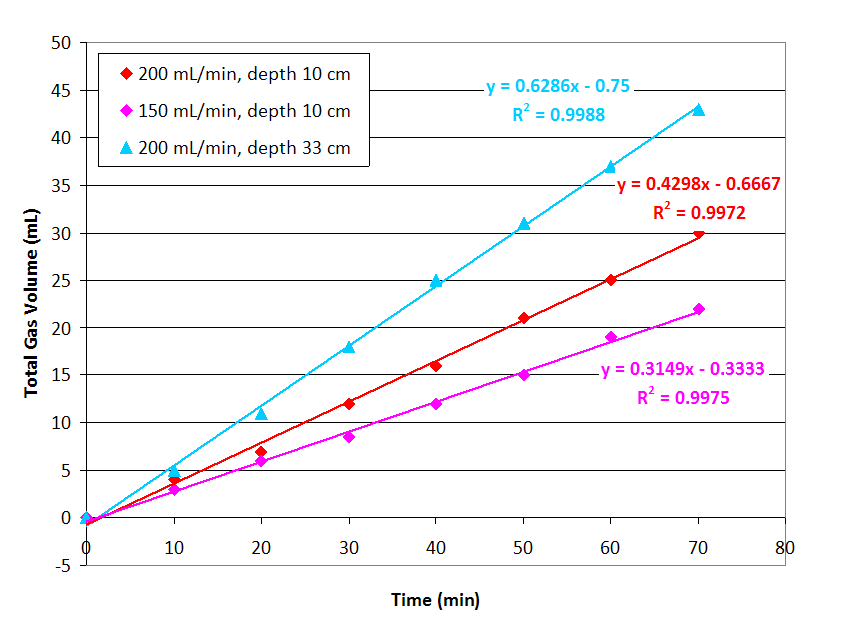
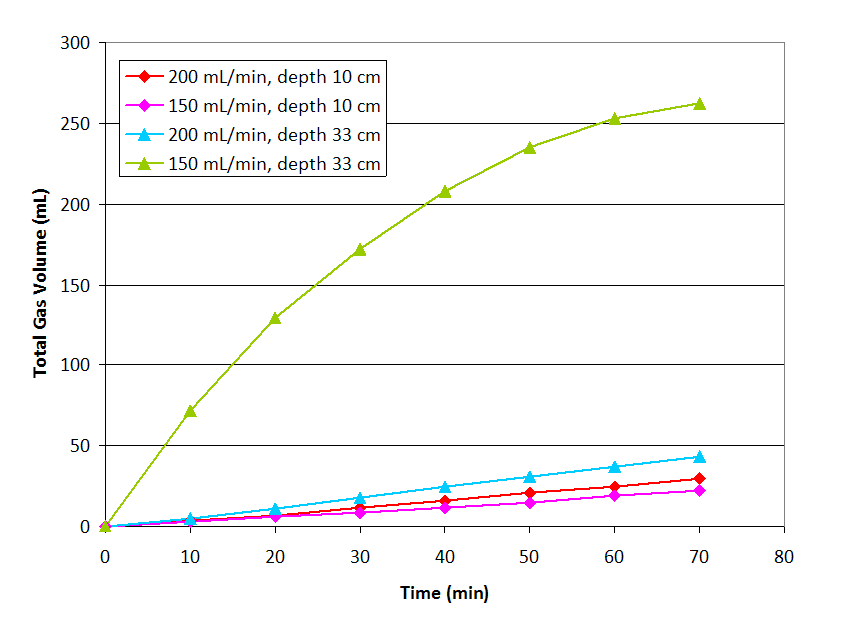
PNG File Fig. 4, vol vs. time, depths adn flow rates 2.png |
11 kB |
user-f9f3e |
May 06, 2009 13:16 |
May 06, 2009 13:16 |
|
Page: Bubble Volume Measurement Method Development
|
|
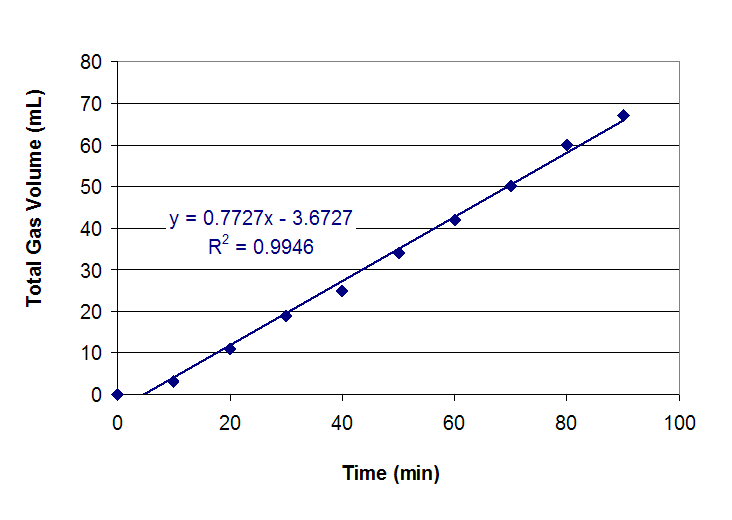
PNG File Fig.1, vol vs. time, 32 cm.png |
6 kB |
user-f9f3e |
May 06, 2009 13:16 |
May 06, 2009 13:16 |
|
Page: Bubble Volume Measurement Method Development
|
|
PNG File Fig. 3, vol vs. time, depths and flow rates.png |
8 kB |
user-f9f3e |
May 06, 2009 13:16 |
May 06, 2009 13:16 |
|
Page: Bubble Volume Measurement Method Development
|