| Name | Size | Creator | Creation Date | Labels | Comment | ||
|---|---|---|---|---|---|---|---|
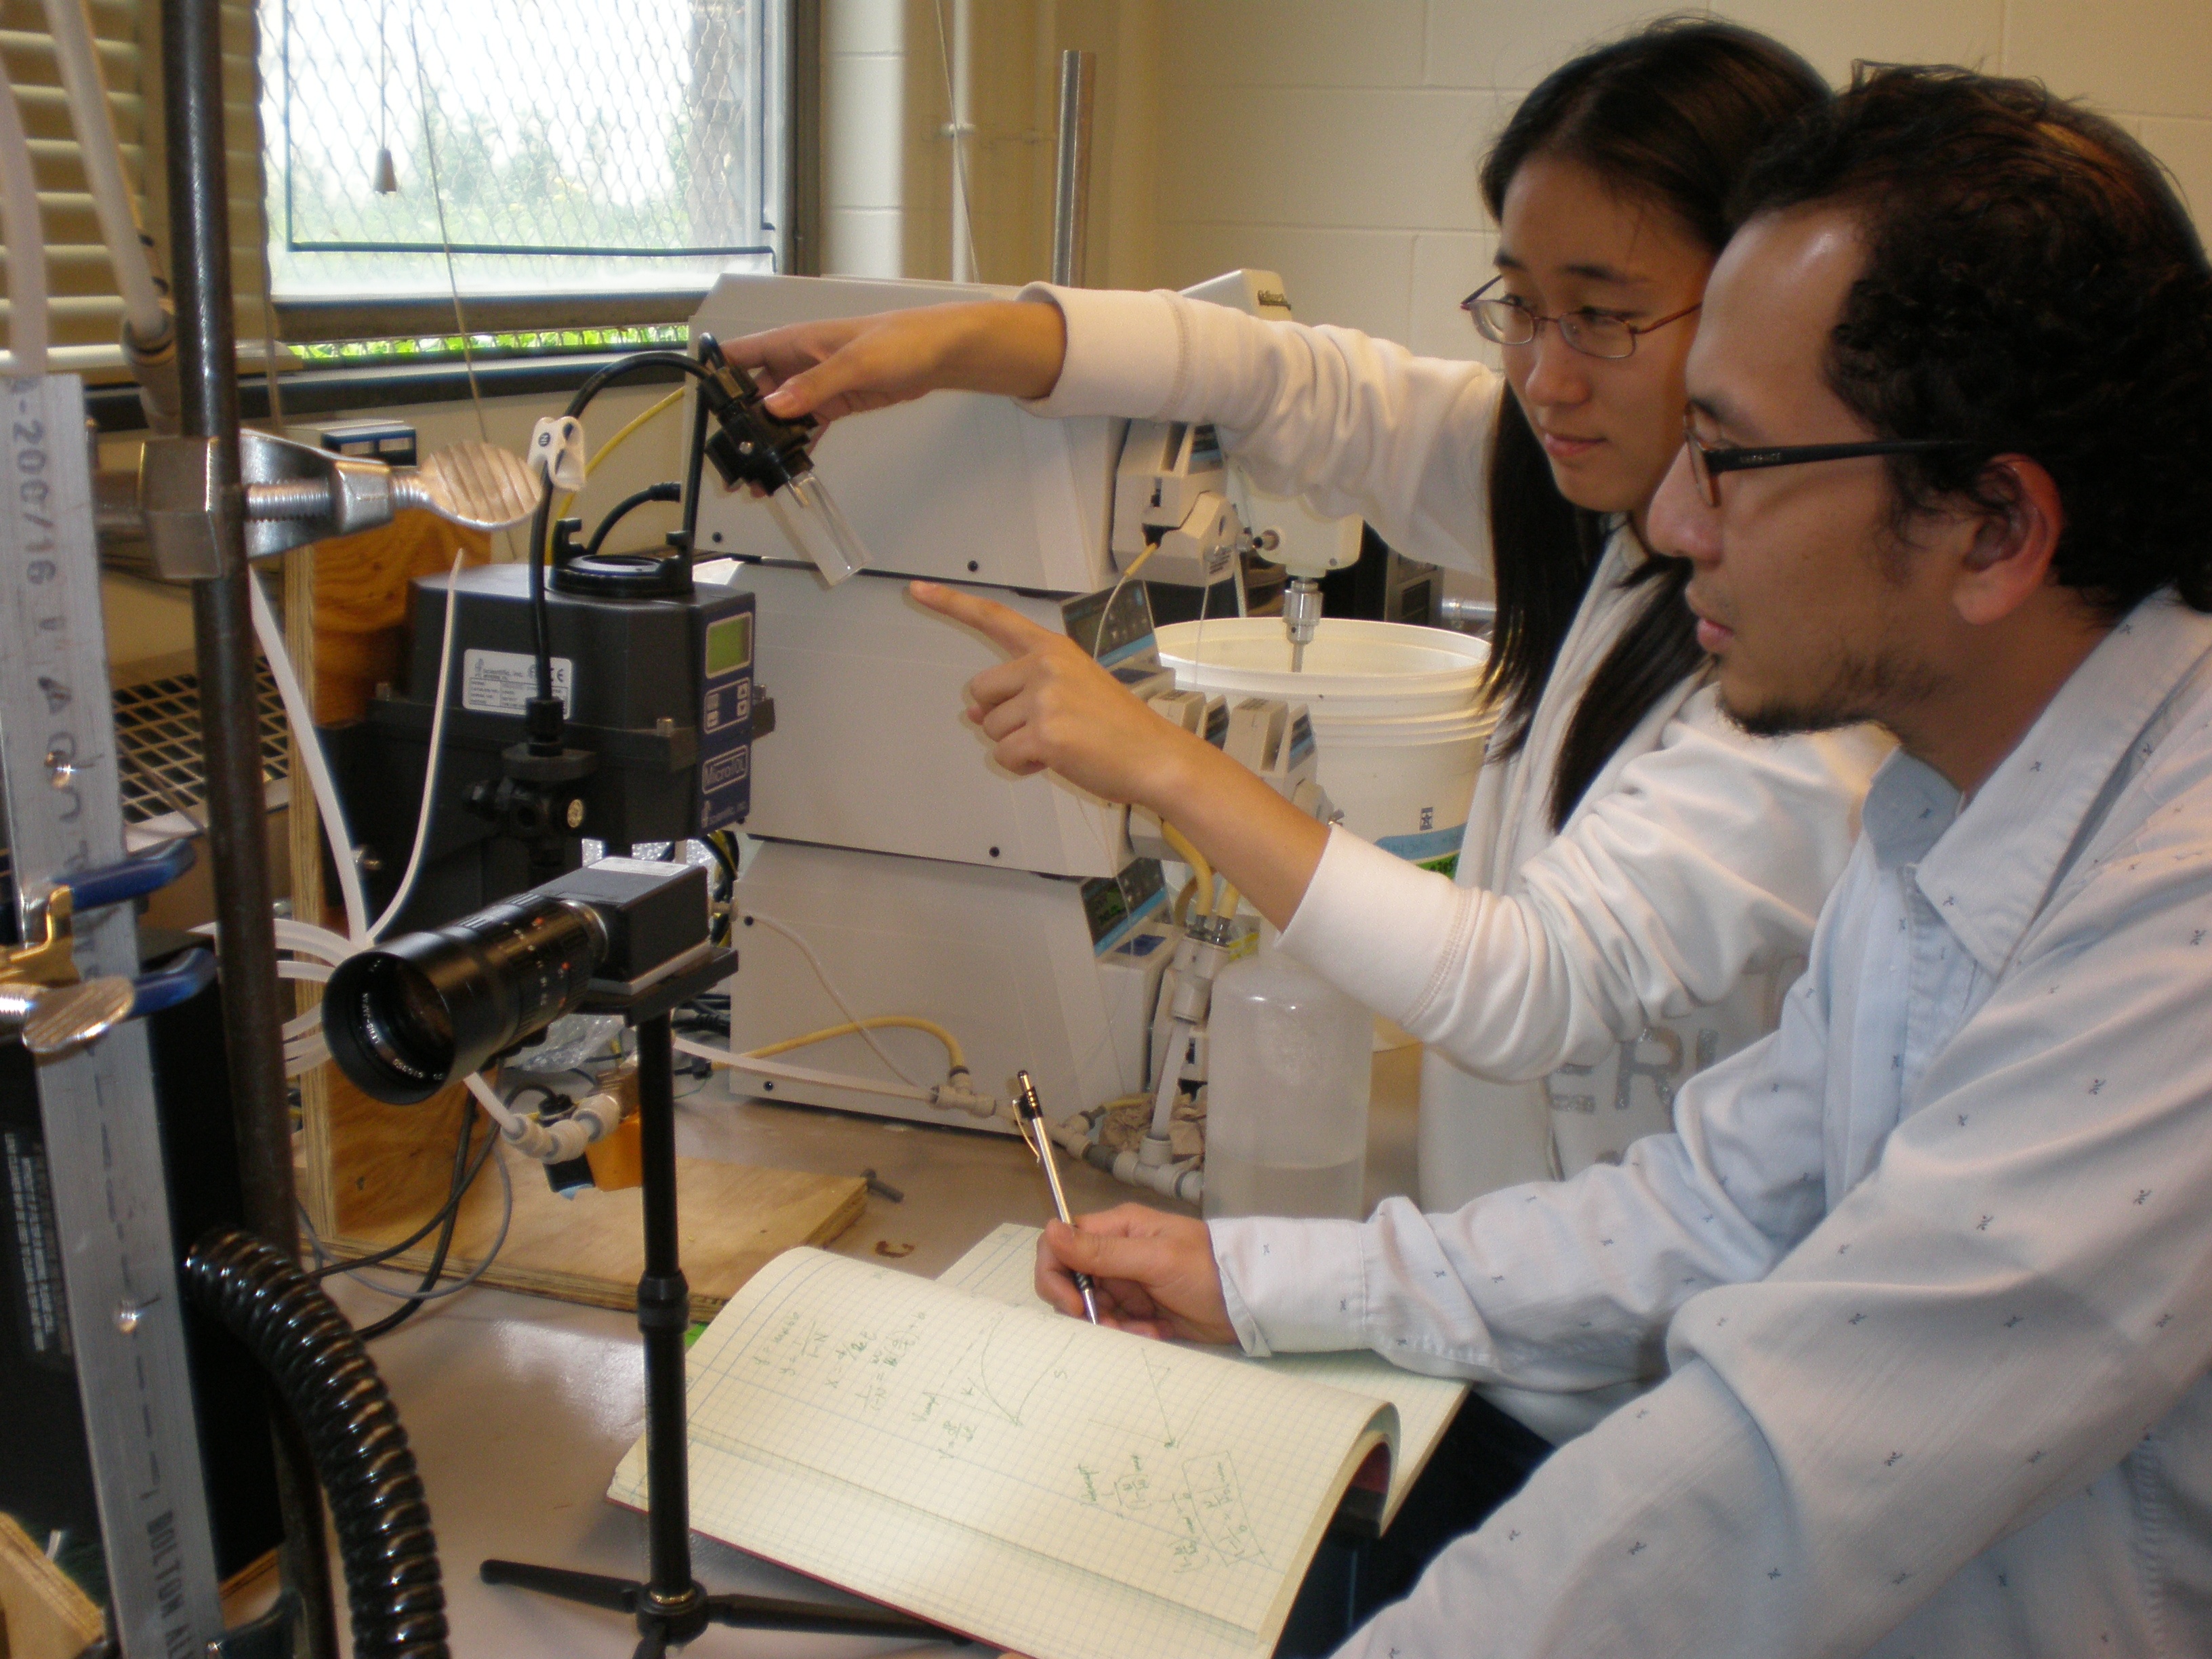
| File P5090004.JPG | 2.79 MB | user-dd1ec | May 13, 2008 00:02 |
|
Wan and Caroline checking turbidimeter in the lab | ||
| Version 1 (current) | 2.79 MB | user-dd1ec | May 13, 2008 00:02 | Wan and Caroline checking turbidimeter in the lab | |||
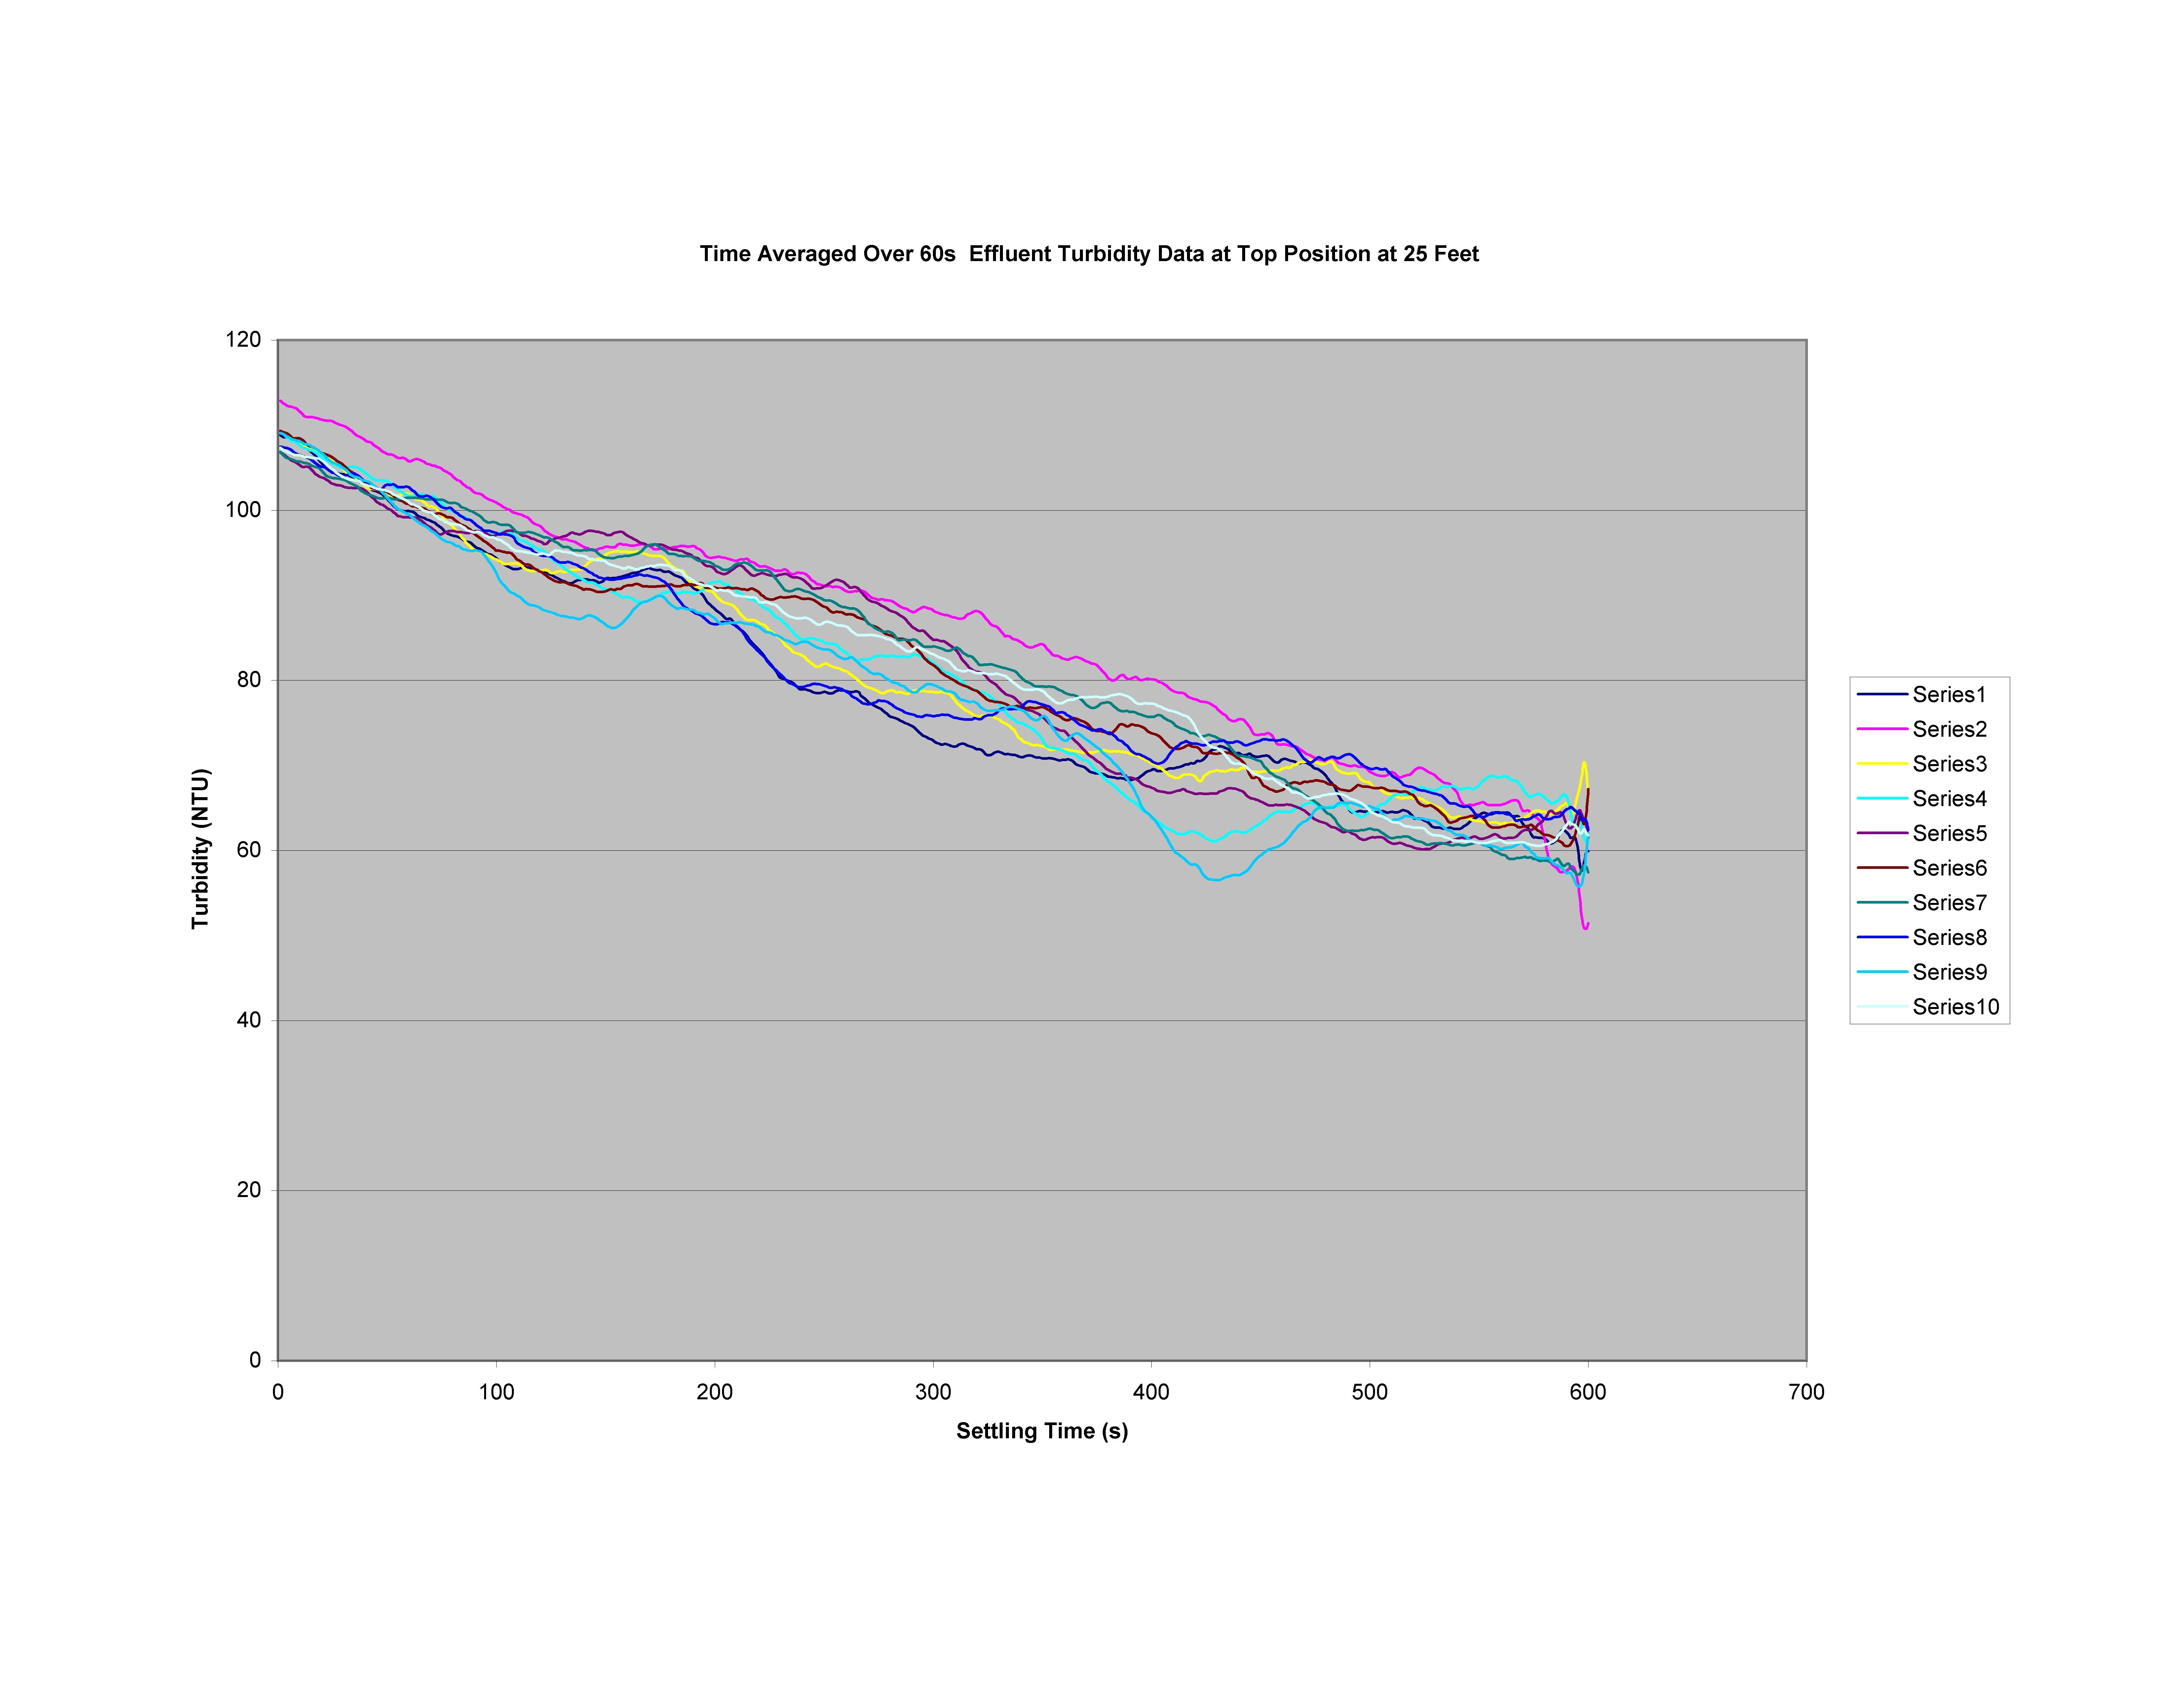
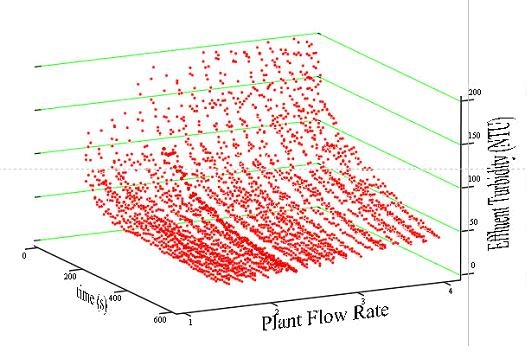
| JPEG File Data Fluctuation.jpg | 1.87 MB | user-27d2e | Mar 13, 2008 14:07 |
|
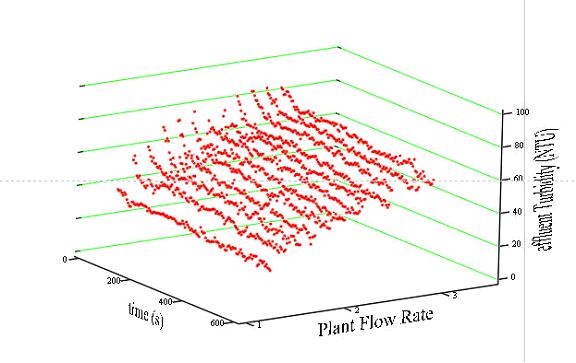
Tube Floc: Top-25 feet-Time Averaged Data | ||
| Version 1 (current) | 1.87 MB | user-27d2e | Mar 13, 2008 14:07 | Tube Floc: Top-25 feet-Time Averaged Data | |||
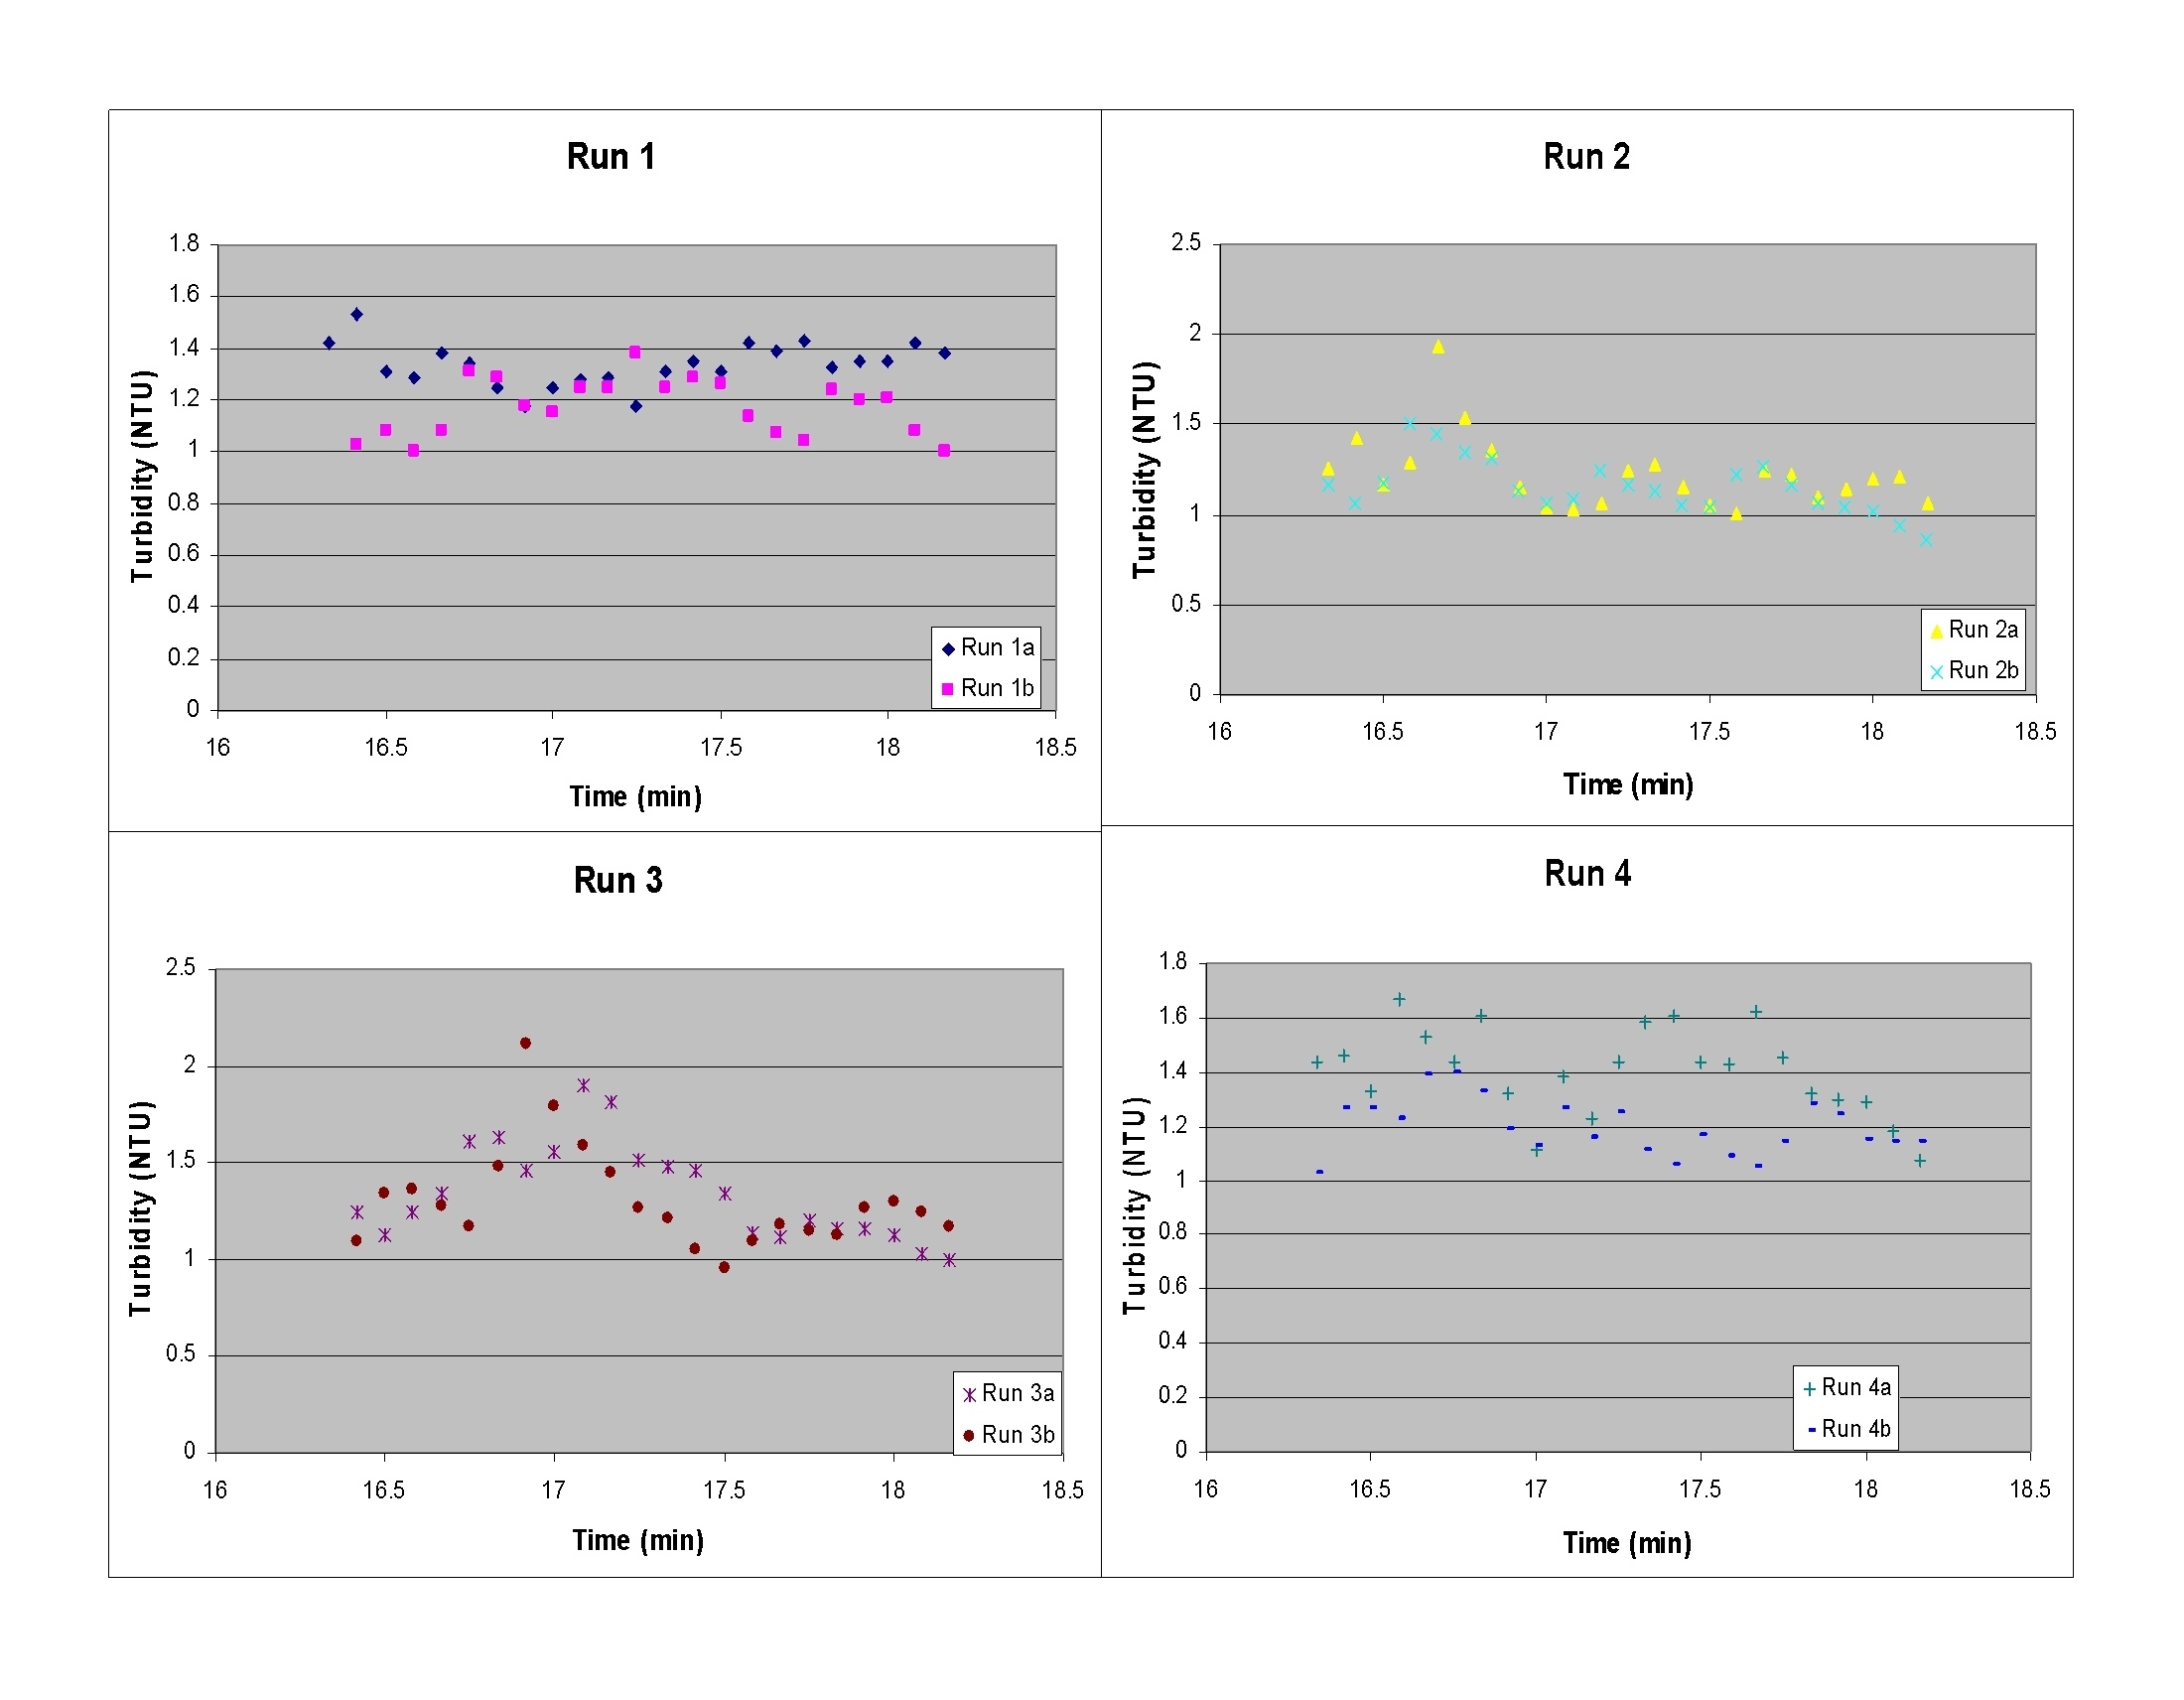
| JPEG File Heat Test Result.jpg | 422 kB | user-ec56f | Feb 27, 2008 19:25 |
|
Tube Floc - Heat Test Results (summer 2007) | ||
| Version 1 (current) | 422 kB | user-ec56f | Feb 27, 2008 19:25 | Tube Floc - Heat Test Results (summer 2007) | |||
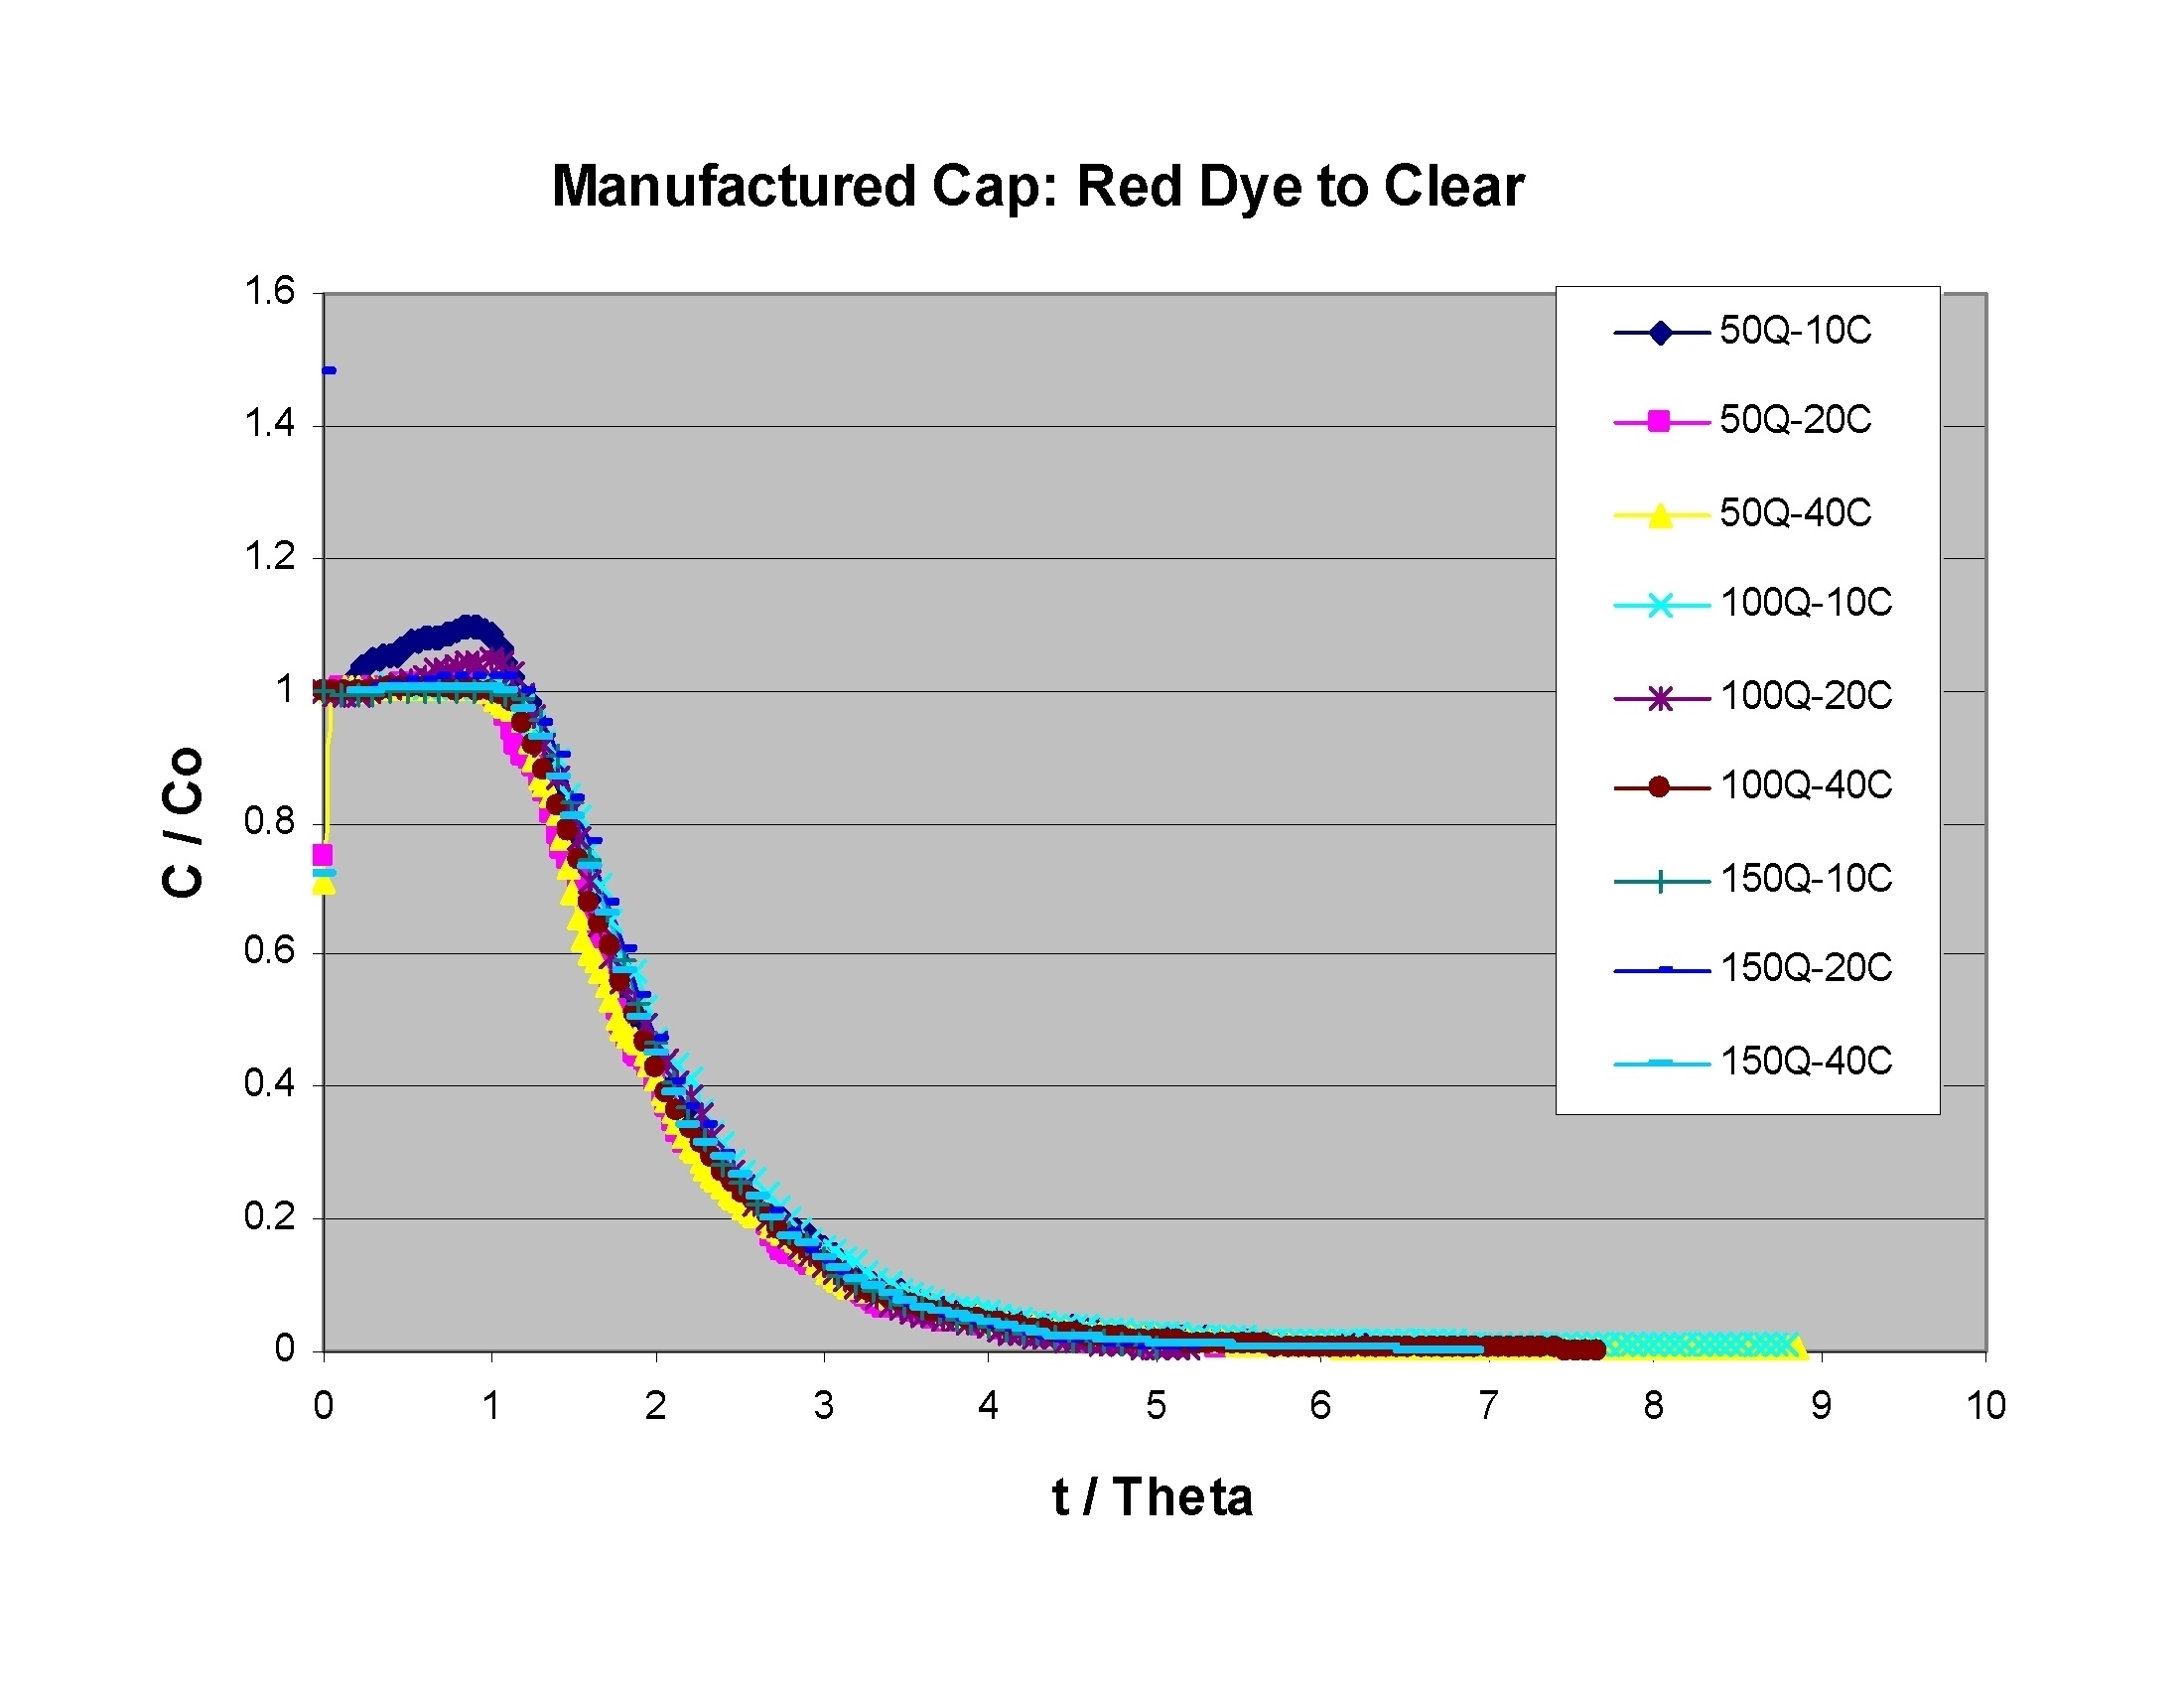
| JPEG File Old Effluent Chamber.jpg | 414 kB | user-ec56f | Feb 27, 2008 19:29 |
|
Tube Floc - Manufactured Cap (summer 2007) | ||
| Version 1 (current) | 414 kB | user-ec56f | Feb 27, 2008 19:29 | Tube Floc - Manufactured Cap (summer 2007) | |||
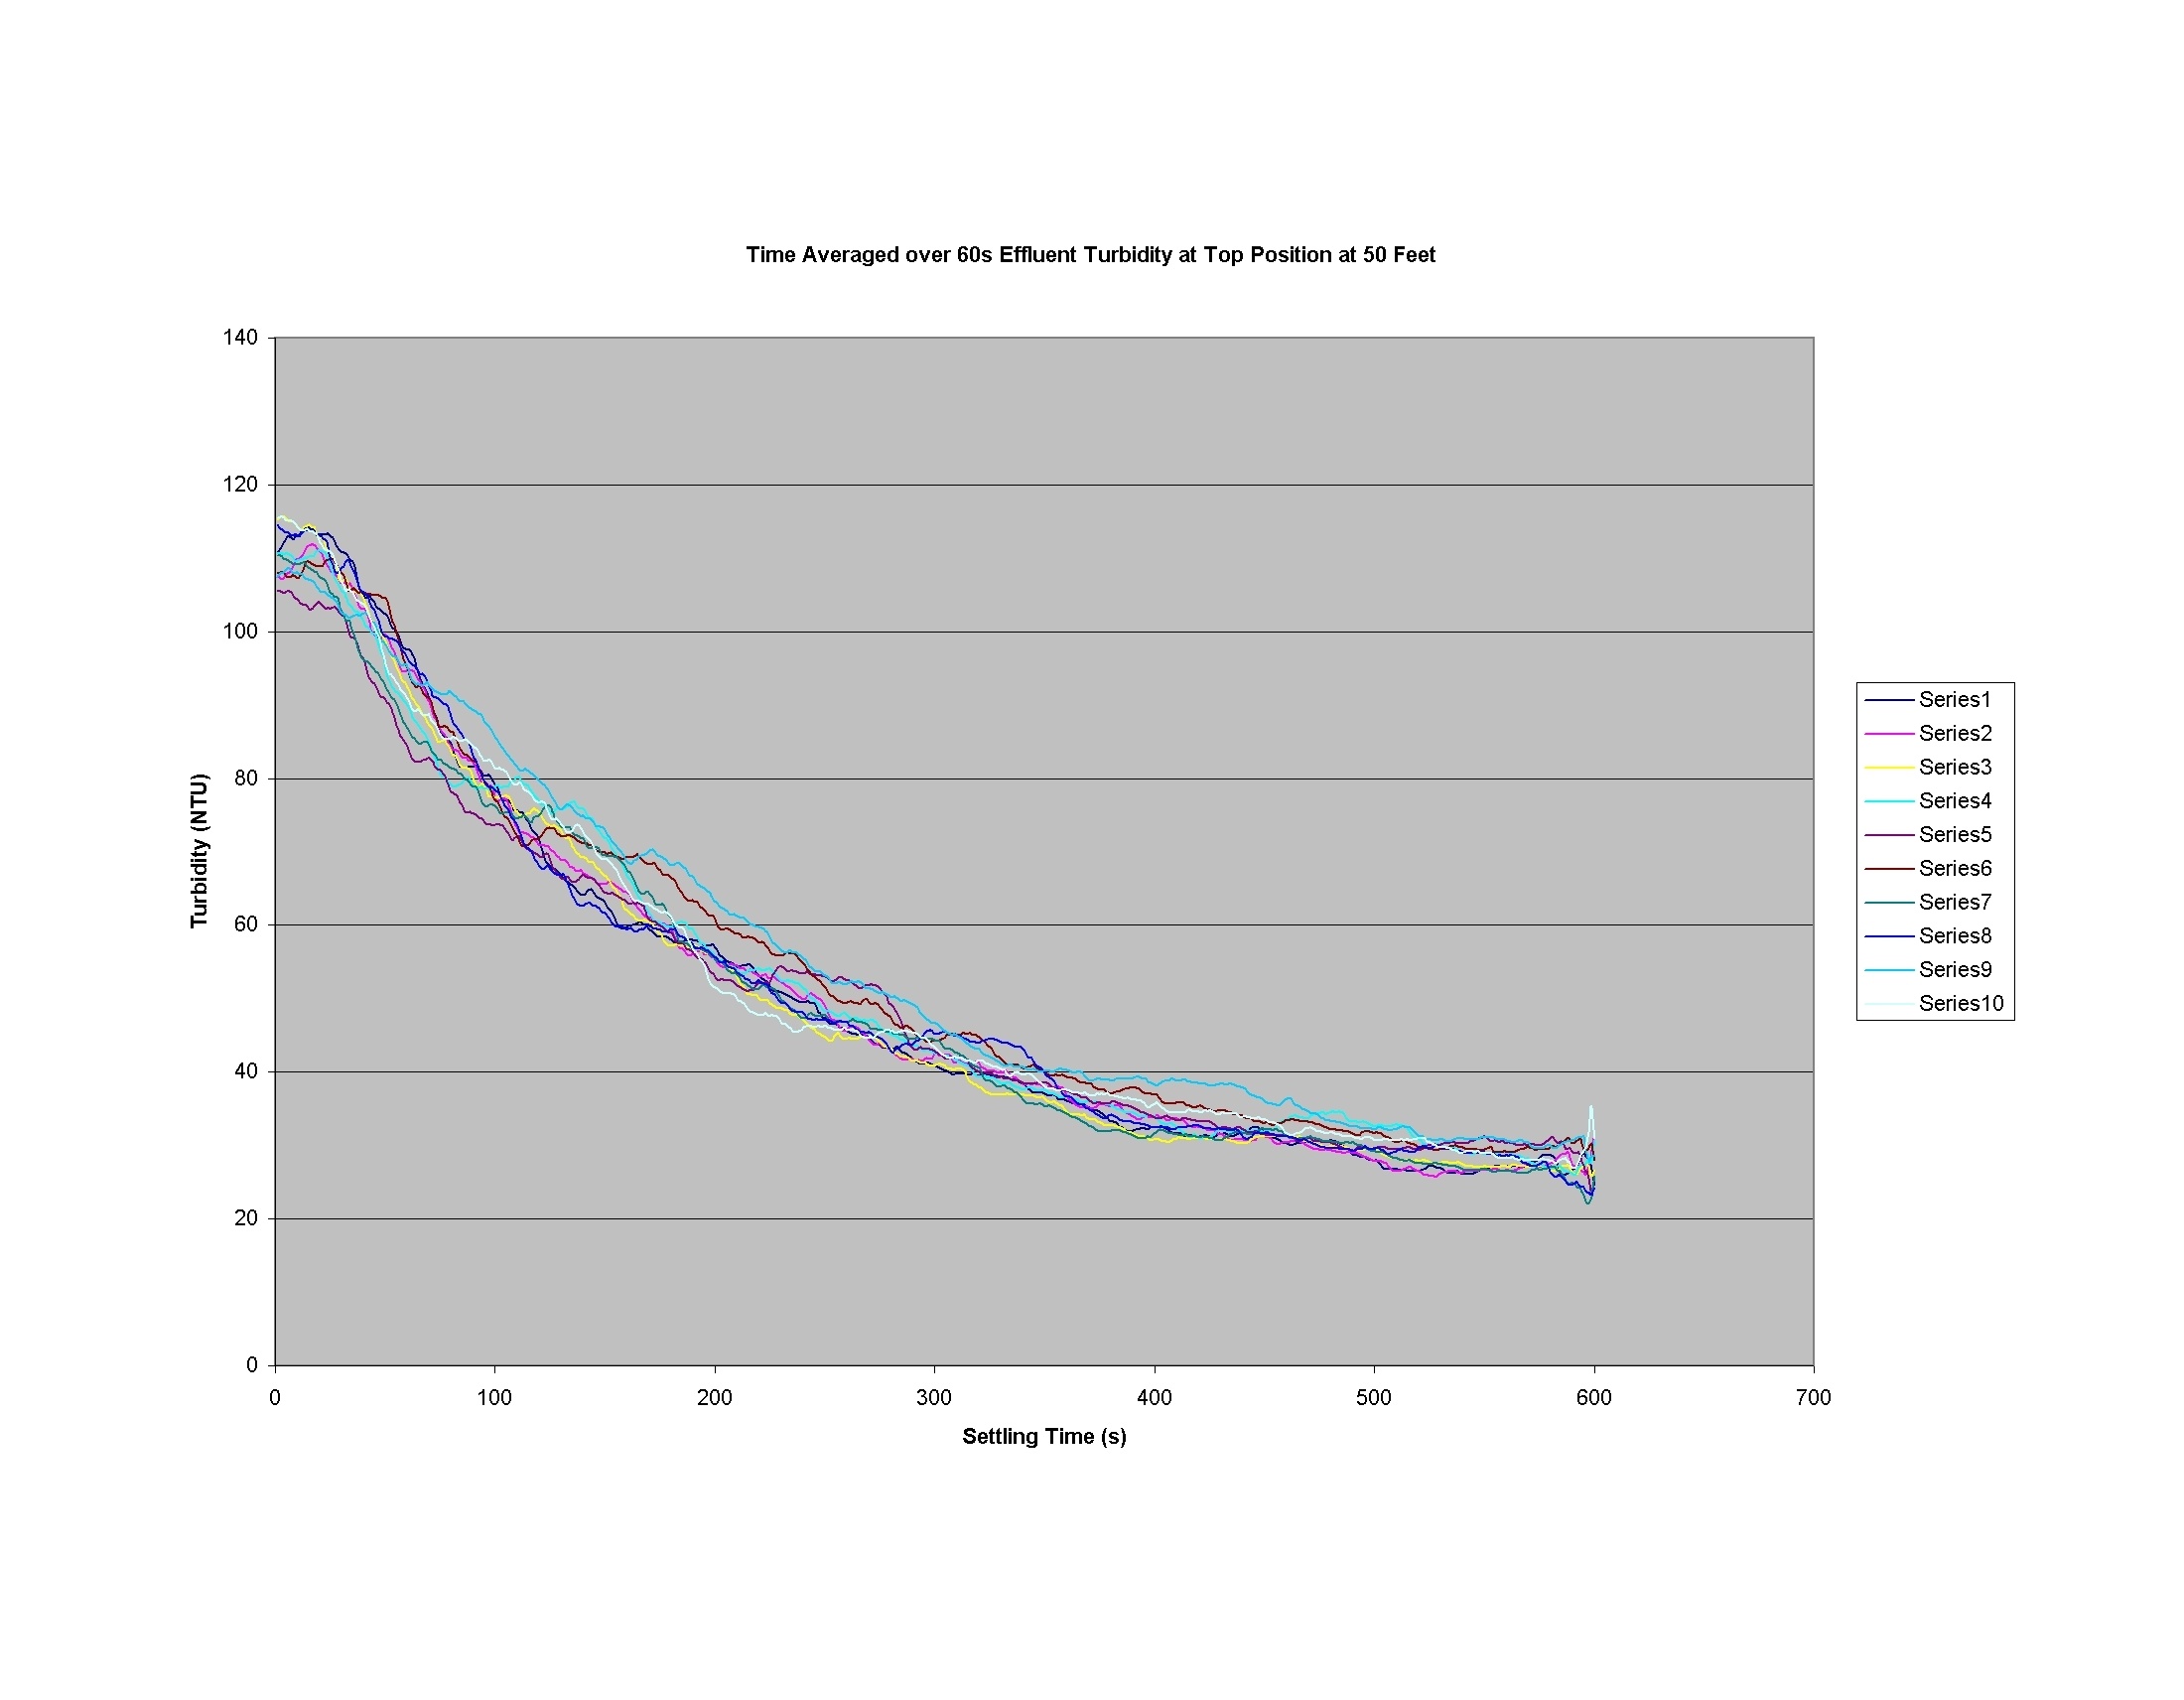
| JPEG File Copy of Data Fluctuation - 3.6.08 - 50ft, 3.1Q(2).jpg | 332 kB | user-27d2e | Mar 13, 2008 14:06 |
|
Tube Floc: Top-50Ft-TimeAvgeraged Data | ||
| Version 2 (current) | 332 kB | user-27d2e | Mar 13, 2008 14:06 | Tube Floc: Top-50Ft-TimeAvgeraged Data | |||
| Version 1 | 288 kB | user-27d2e | Mar 13, 2008 14:06 | Tube Floc: Top-50Ft-TimeAvgeraged Data | |||
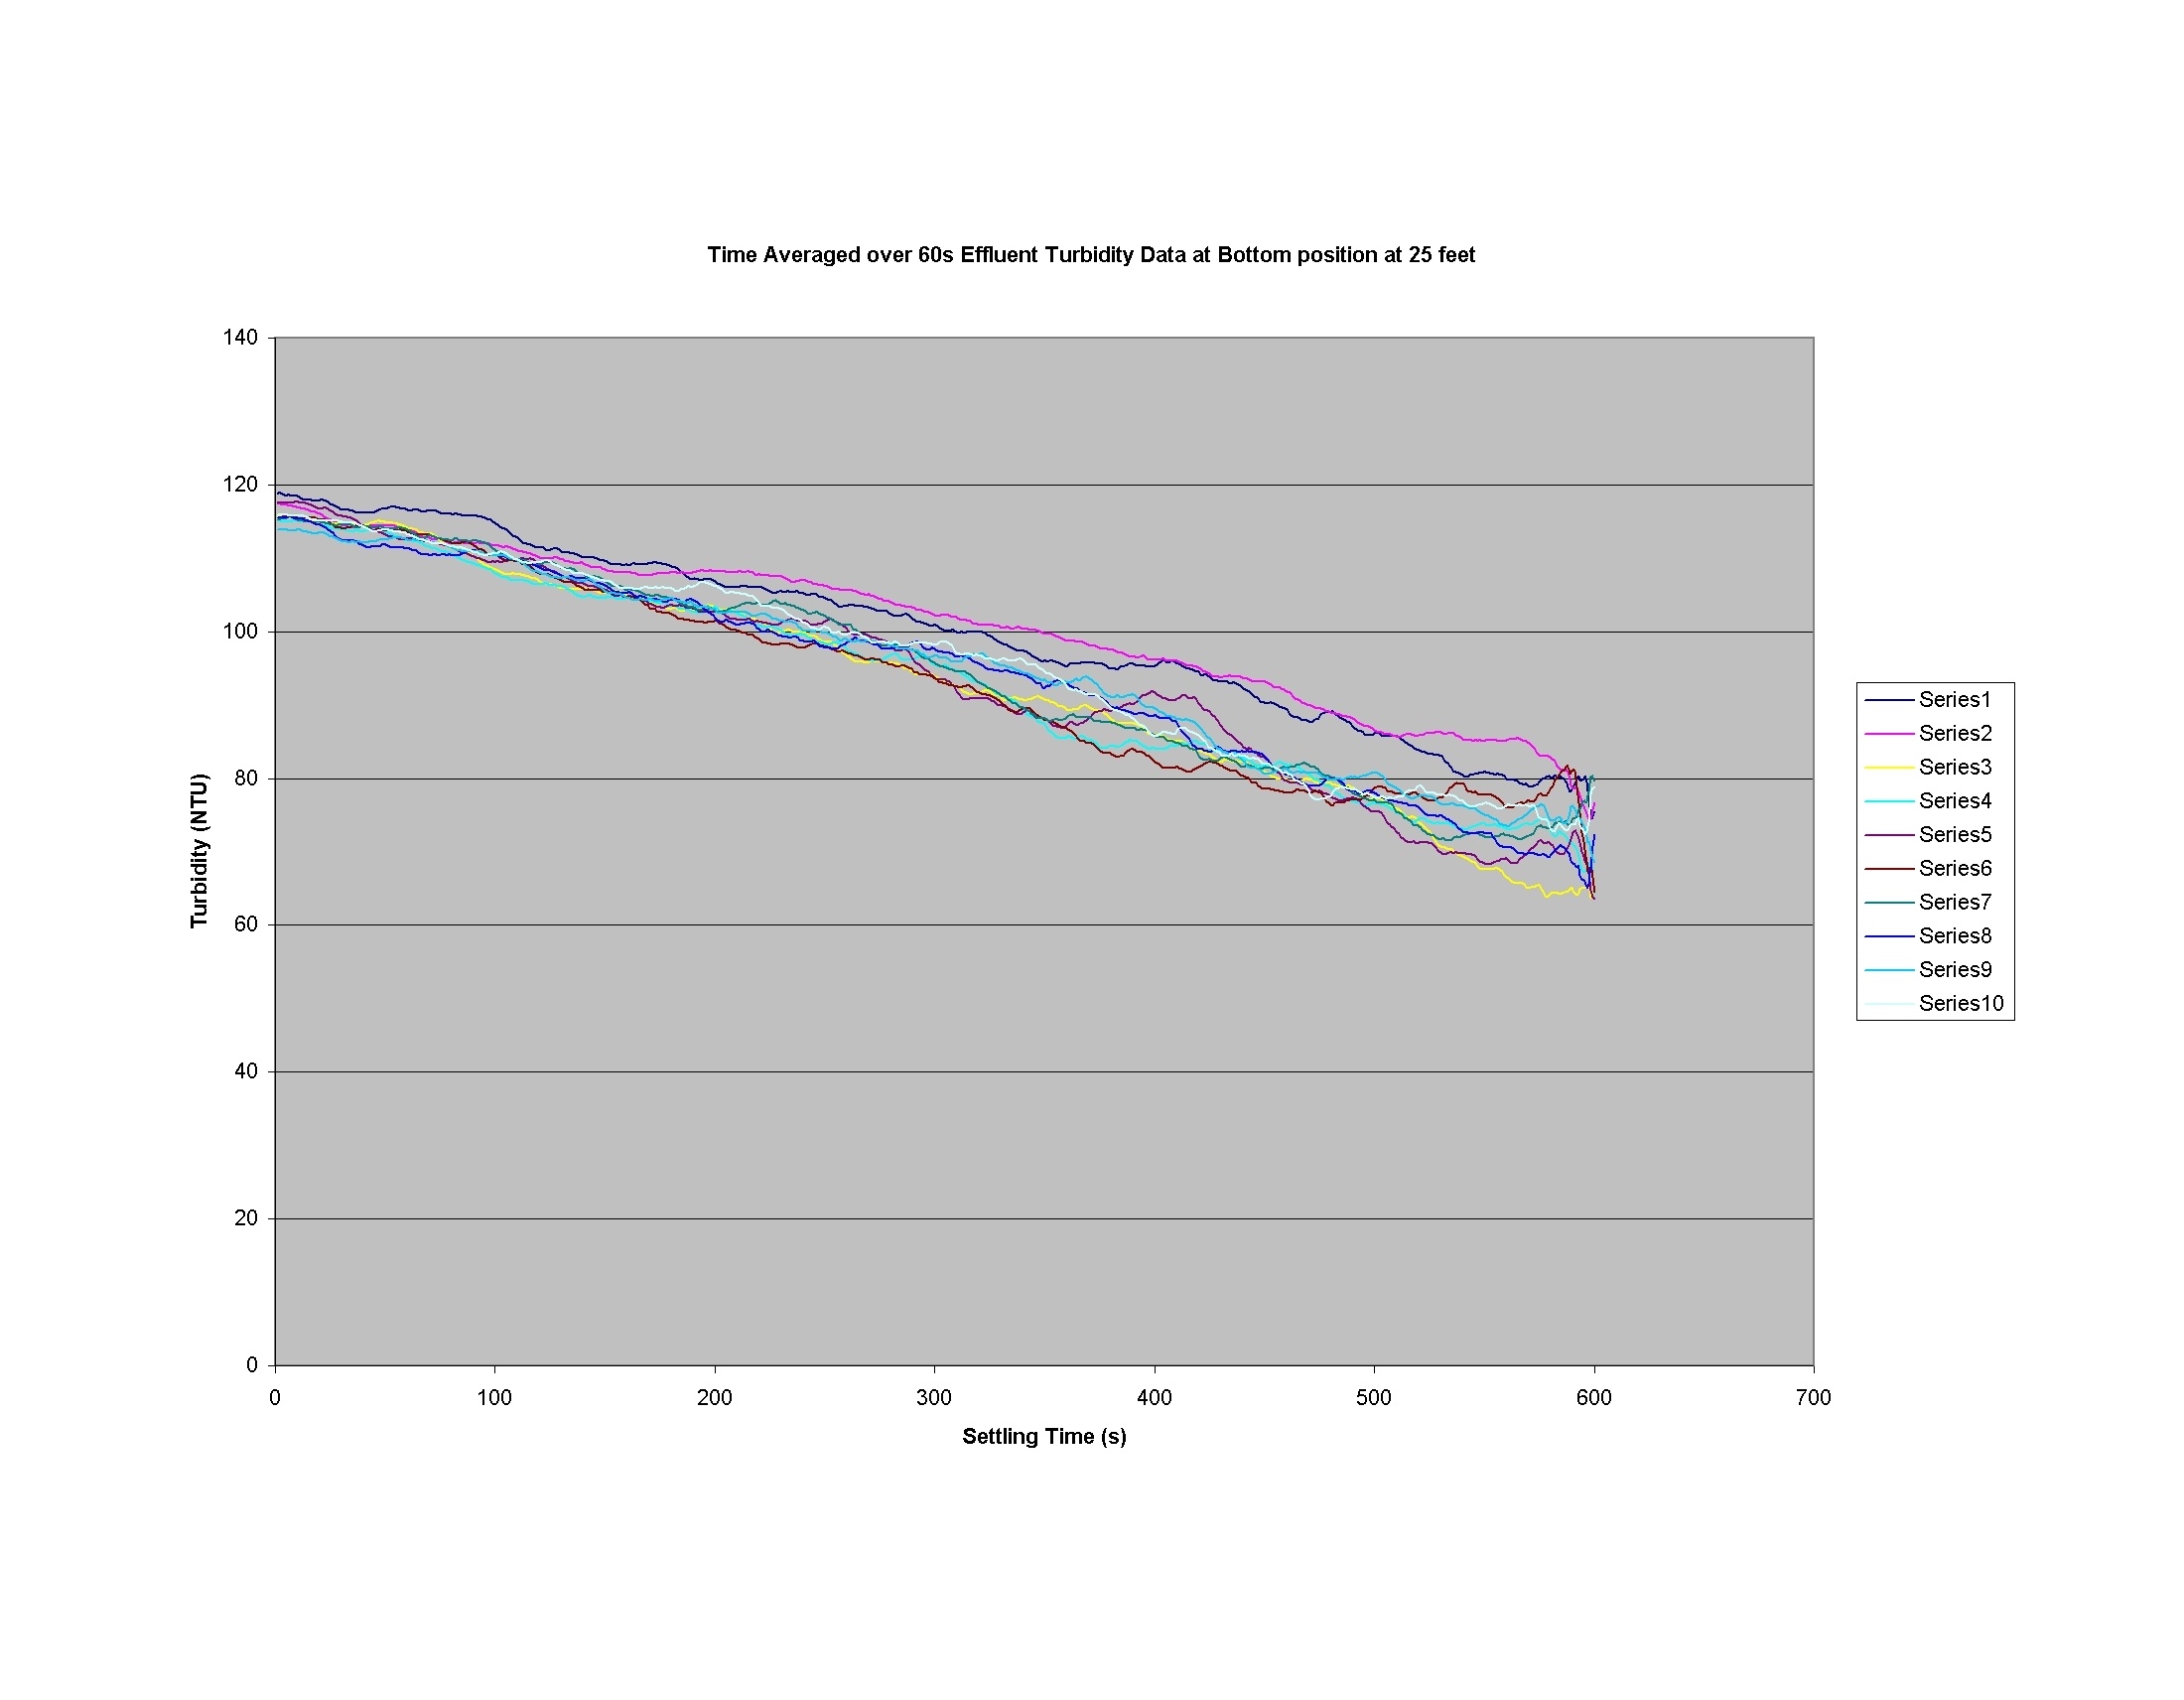
| JPEG File Fluctuation.jpg | 328 kB | user-27d2e | Mar 13, 2008 14:07 |
|
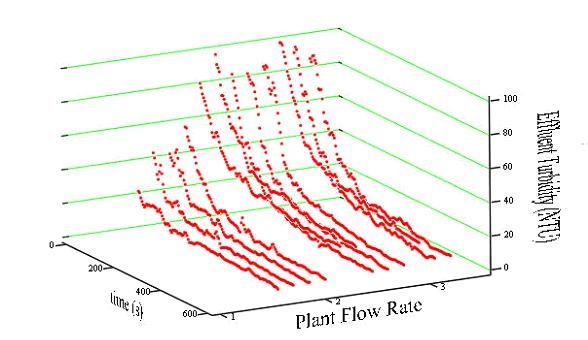
Tube Floc: Bottom-25 feet-Time Averaged Data | ||
| Version 1 (current) | 328 kB | user-27d2e | Mar 13, 2008 14:07 | Tube Floc: Bottom-25 feet-Time Averaged Data | |||
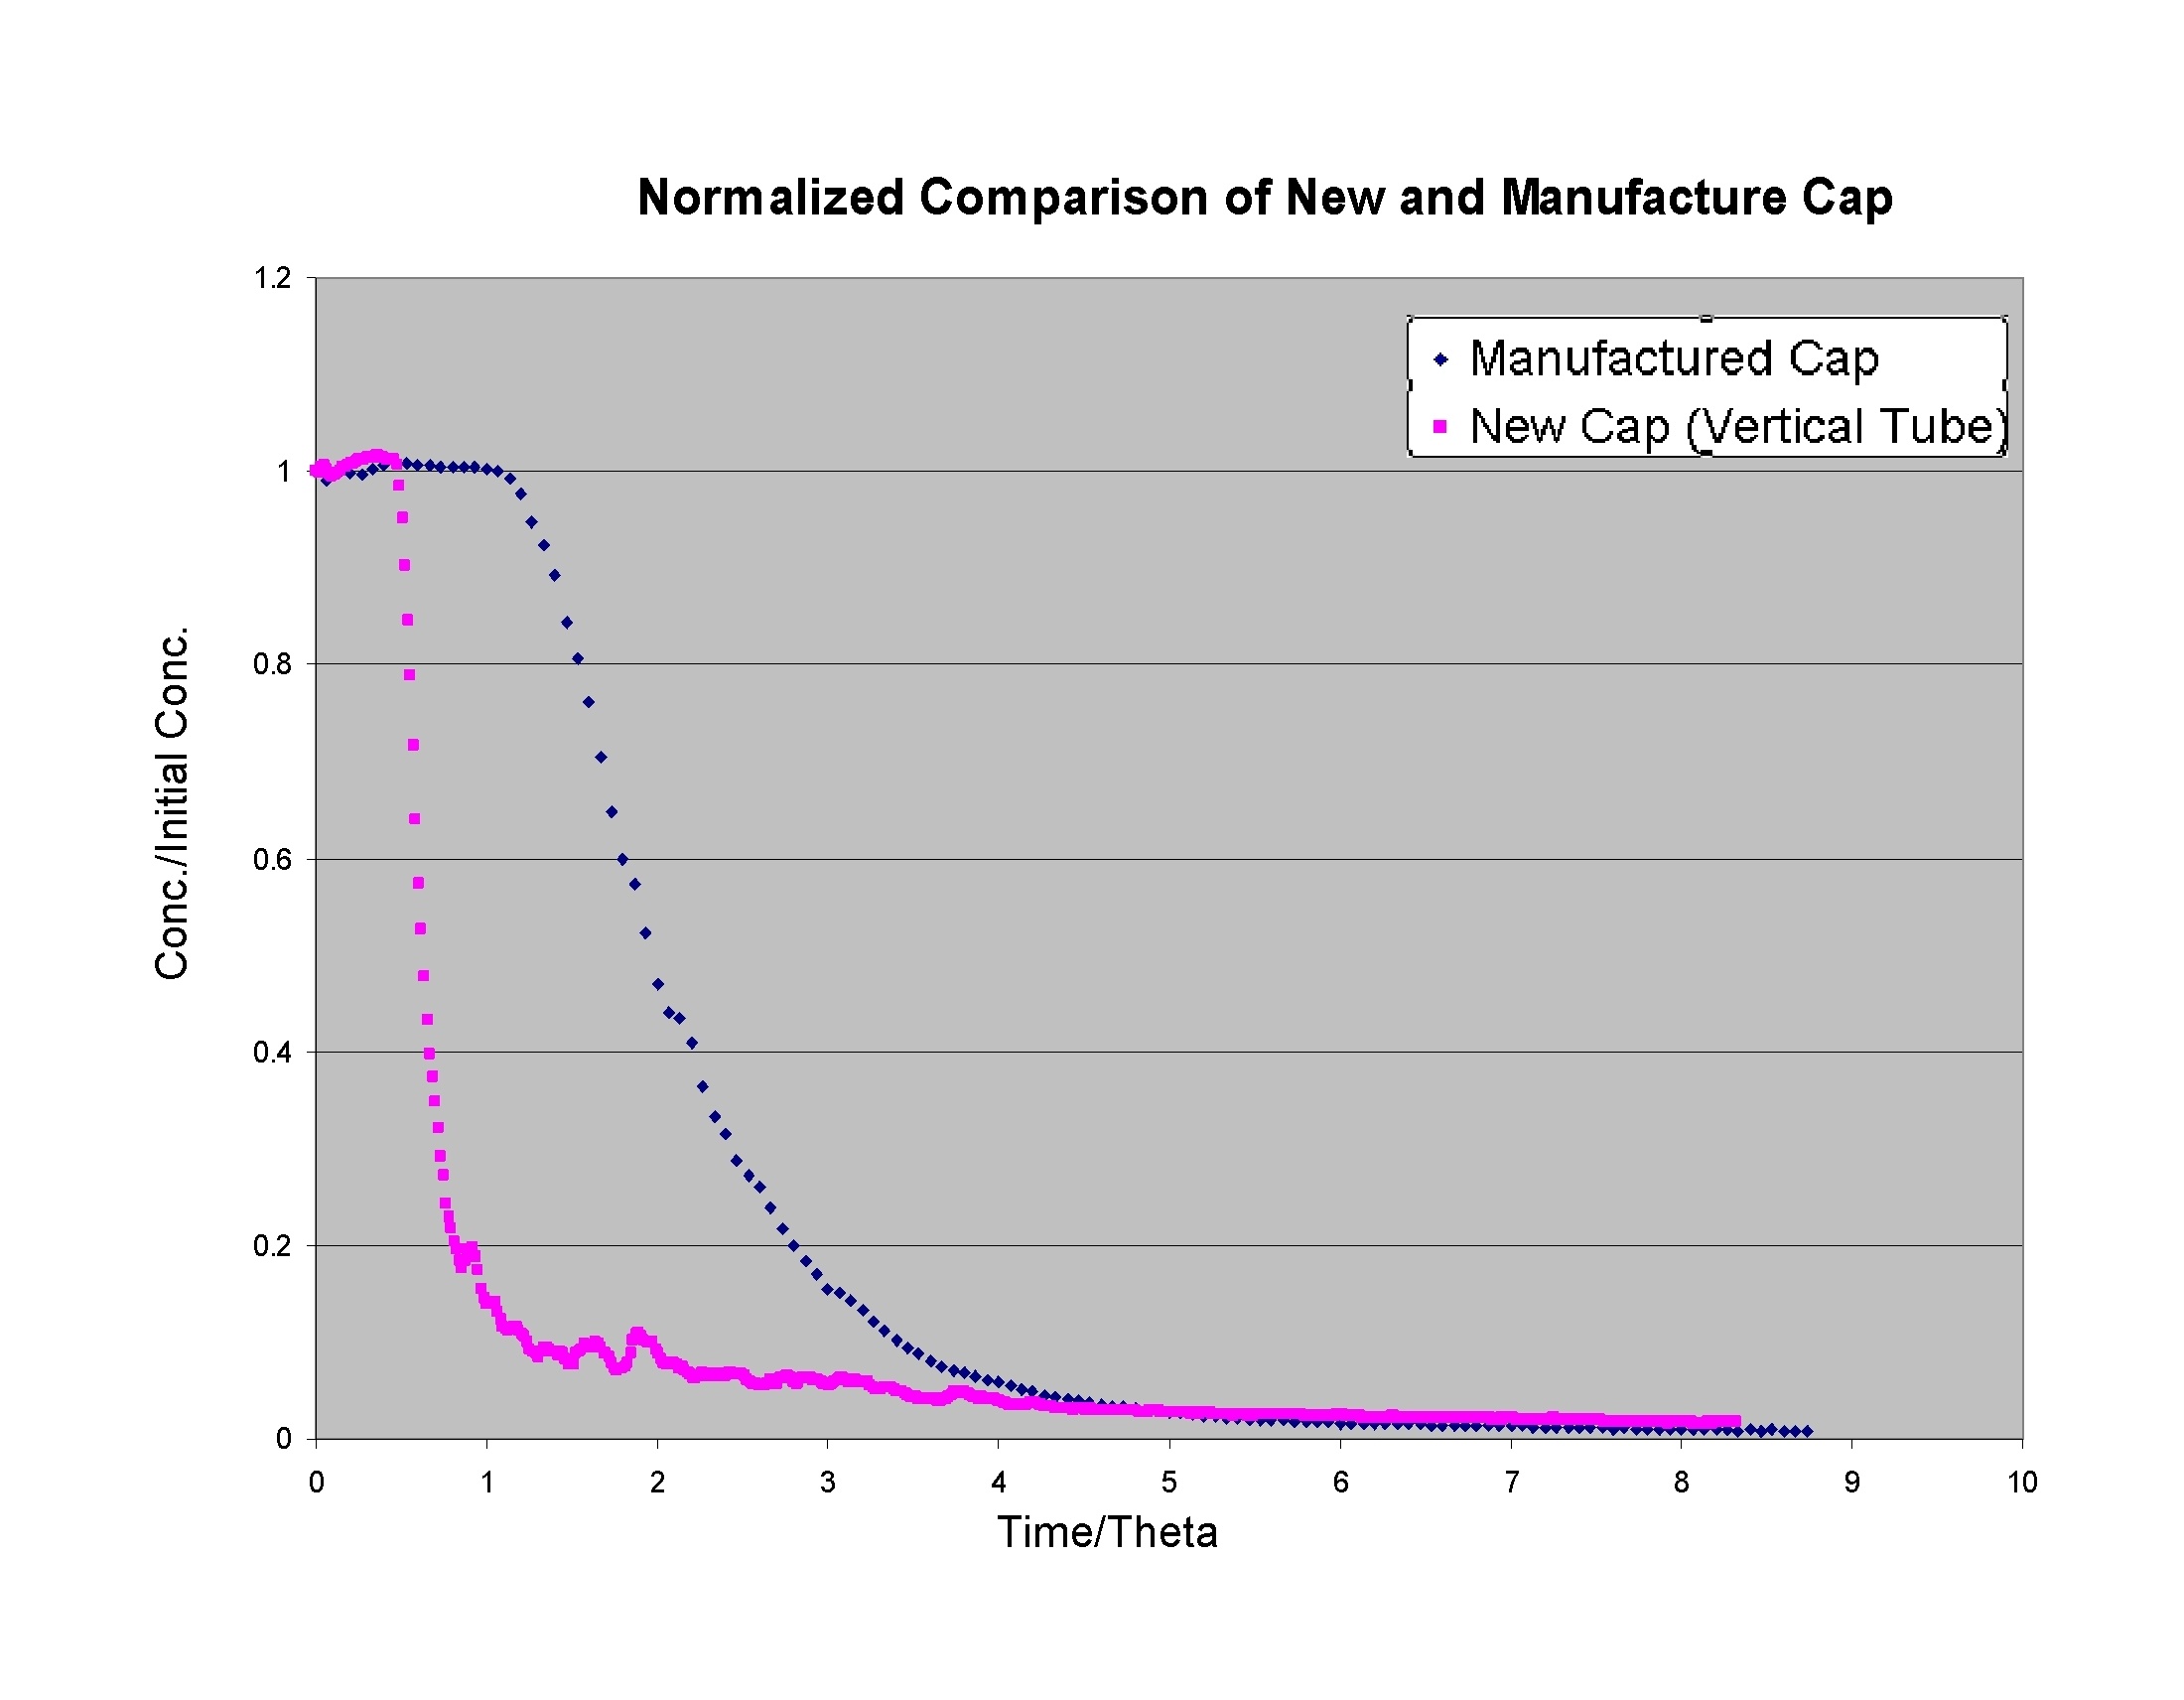
| JPEG File Effluent Chamber Comparison.jpg | 324 kB | user-ec56f | Feb 27, 2008 19:27 |
|
Tube Floc - Cap Comparison (summer 2007) | ||
| Version 1 (current) | 324 kB | user-ec56f | Feb 27, 2008 19:27 | Tube Floc - Cap Comparison (summer 2007) | |||
| GIF File flocPIV.gif | 267 kB | user-3cacb | May 11, 2008 14:00 |
|
Tube Floc - Flocs during settling state using PIV | ||
| Version 1 (current) | 267 kB | user-3cacb | May 11, 2008 14:00 | Tube Floc - Flocs during settling state using PIV | |||
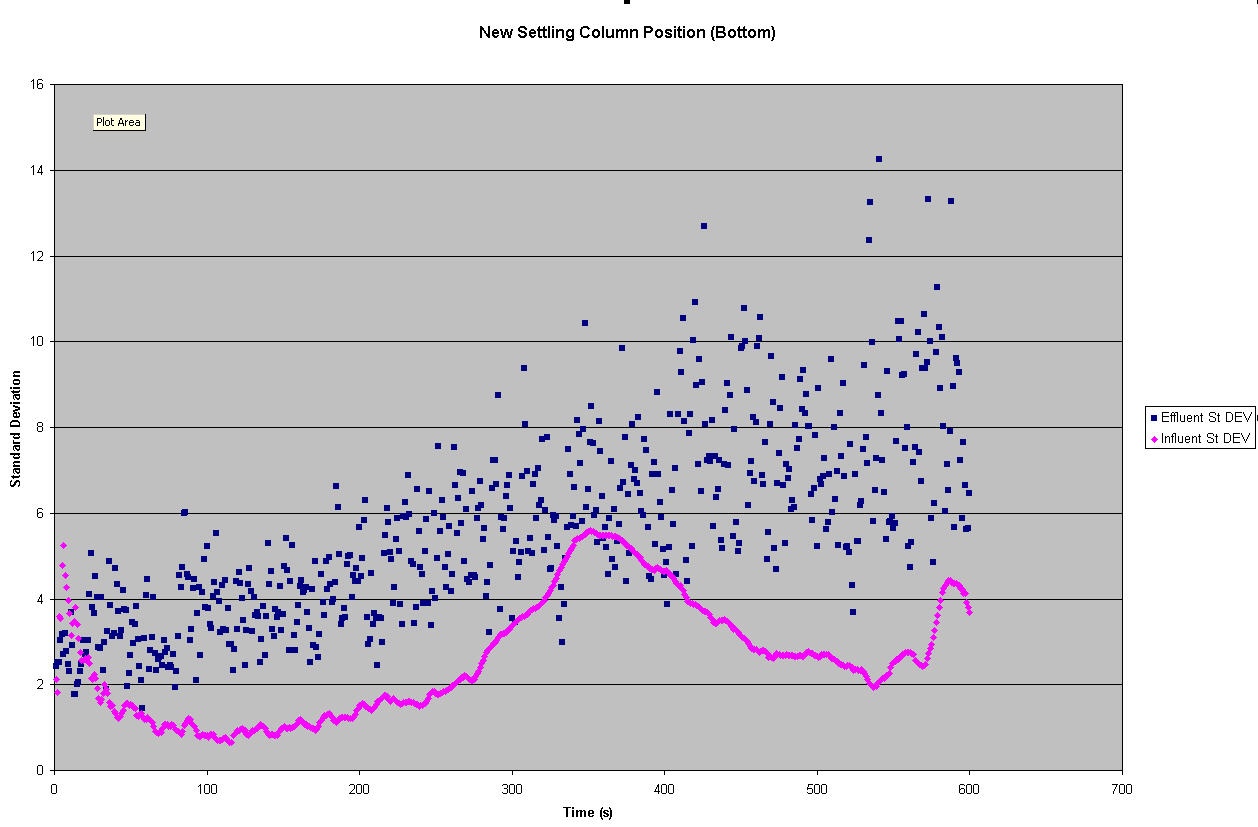
| JPEG File Bottom-St Dev Graph.jpg | 125 kB | user-27d2e | Mar 10, 2008 18:51 |
|
Tube Floc- Data Fluctuation Experiment Bottom position Standard Deviation graph | ||
| Version 1 (current) | 125 kB | user-27d2e | Mar 10, 2008 18:51 | Tube Floc- Data Fluctuation Experiment Bottom position Standard Deviation graph | |||
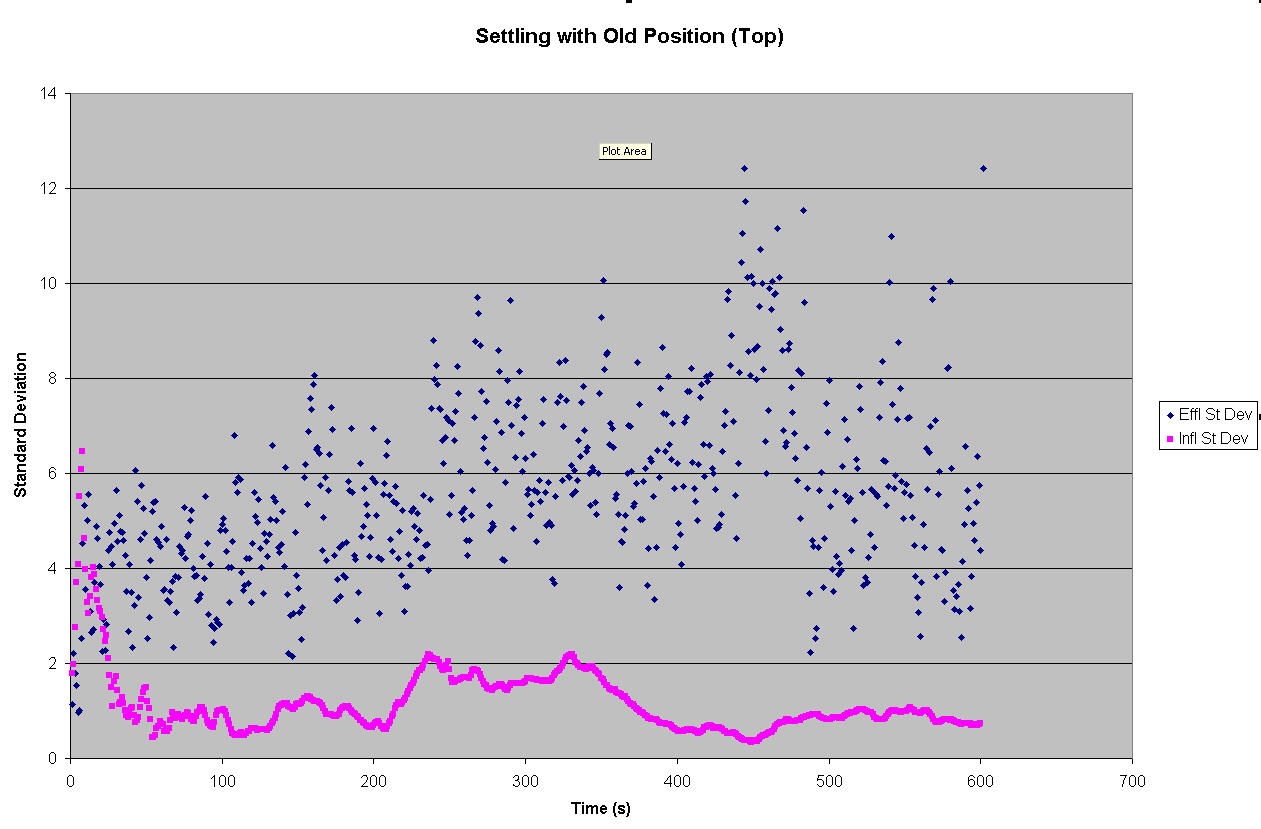
| JPEG File Top-St Dev Graph.jpg | 124 kB | user-27d2e | Mar 10, 2008 18:52 |
|
Tube Floc- Data Fluctuation Experiment Top position Standard Deviation graph | ||
| Version 1 (current) | 124 kB | user-27d2e | Mar 10, 2008 18:52 | Tube Floc- Data Fluctuation Experiment Top position Standard Deviation graph | |||
| GIF File circulation.gif | 75 kB | user-3cacb | May 11, 2008 14:36 |
|
Tube Floc - Turbidimeter circulation animation | ||
| Version 1 (current) | 75 kB | user-3cacb | May 11, 2008 14:36 | Tube Floc - Turbidimeter circulation animation | |||
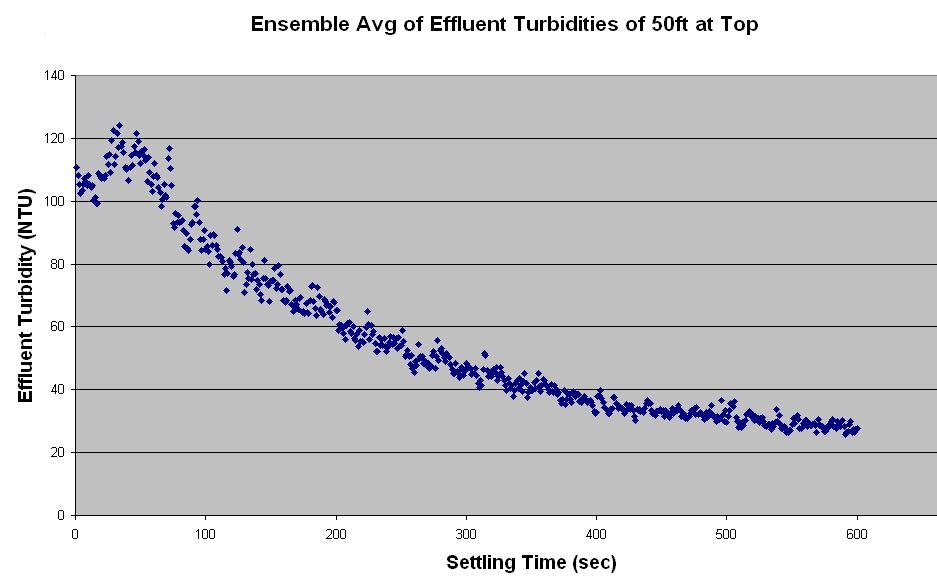
| JPEG File Ensemble Averaged 50ft Top.JPG | 50 kB | user-ec56f | Mar 14, 2008 16:52 |
|
Tube Floc - Ensemble Averaged 50ft Top | ||
| Version 1 (current) | 50 kB | user-ec56f | Mar 14, 2008 16:52 | Tube Floc - Ensemble Averaged 50ft Top | |||
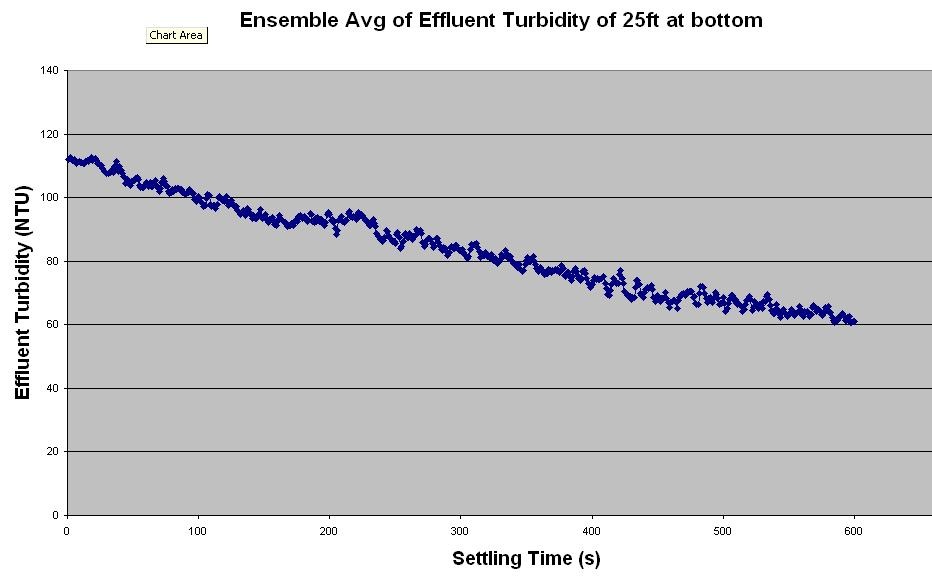
| JPEG File Ensemble Averaged 25ft Bottom.JPG | 46 kB | user-ec56f | Mar 14, 2008 16:51 |
|
Tube Floc - Ensemble Averaged 25ft Bottom | ||
| Version 1 (current) | 46 kB | user-ec56f | Mar 14, 2008 16:51 | Tube Floc - Ensemble Averaged 25ft Bottom | |||
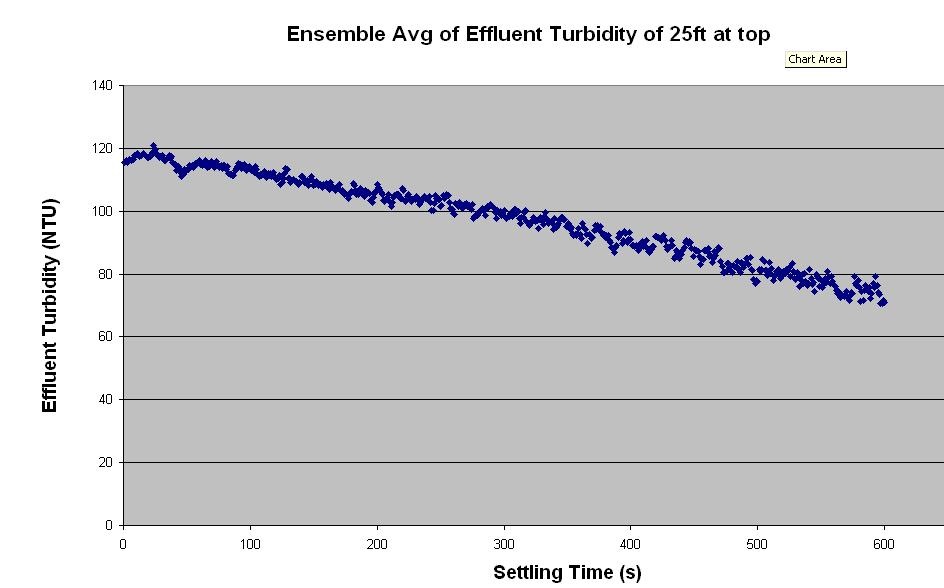
| JPEG File Ensemble Averaged 25ft Top.JPG | 45 kB | user-ec56f | Mar 14, 2008 16:51 |
|
Tube Floc - Ensemble Averaged 25ft Top | ||
| Version 1 (current) | 45 kB | user-ec56f | Mar 14, 2008 16:51 | Tube Floc - Ensemble Averaged 25ft Top | |||
| File figure10.JPG | 41 kB | user-27d2e | Feb 27, 2008 14:10 |
|
Tube Floc- settling curves for various G's at 50-125 NTU at 25 ft | ||
| Version 1 (current) | 41 kB | user-27d2e | Feb 27, 2008 14:10 | Tube Floc- settling curves for various G's at 50-125 NTU at 25 ft | |||
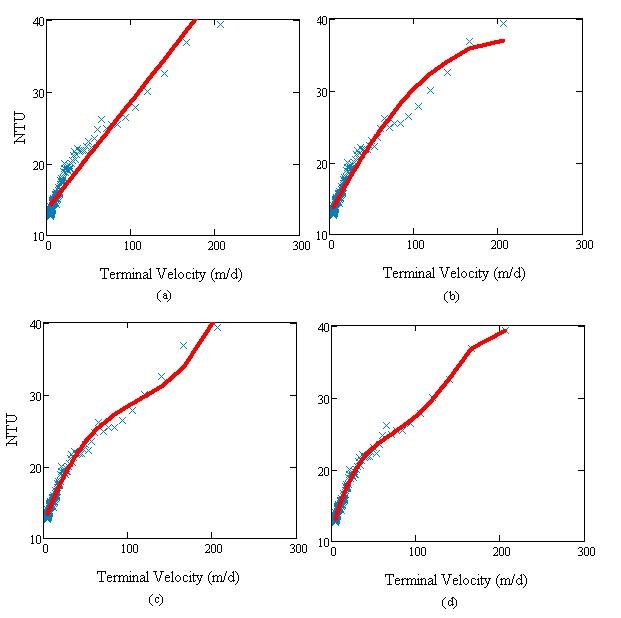
| JPEG File NTU Vc Regression.JPG | 39 kB | user-3cacb | Feb 25, 2008 09:15 |
|
Tube Floc - Turbidity vs Terminal Velocity with Polynomial Regression | ||
| Version 1 (current) | 39 kB | user-3cacb | Feb 25, 2008 09:15 | Tube Floc - Turbidity vs Terminal Velocity with Polynomial Regression | |||
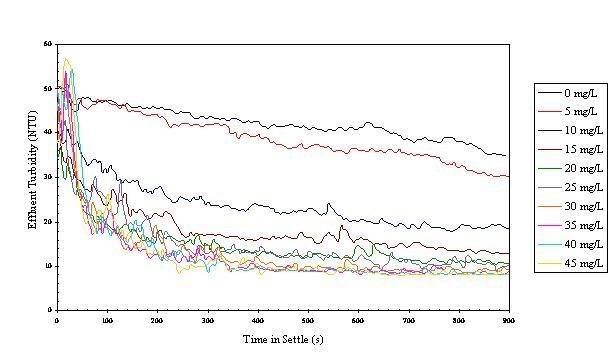
| JPEG File Alumat75NTU.JPG | 35 kB | user-27d2e | Feb 26, 2008 16:54 |
|
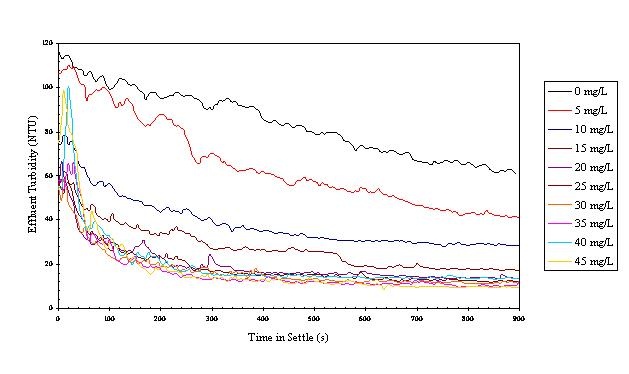
Tube Floc-Settling curves for various alum doses at influent turbidity 75 NTU | ||
| Version 1 (current) | 35 kB | user-27d2e | Feb 26, 2008 16:54 | Tube Floc-Settling curves for various alum doses at influent turbidity 75 NTU | |||
| JPEG File Alumat150NTU.JPG | 34 kB | user-27d2e | Feb 26, 2008 16:54 |
|
Tube Floc-Settling curves for various alum doses at influent turbidity 150 NTU | ||
| Version 1 (current) | 34 kB | user-27d2e | Feb 26, 2008 16:54 | Tube Floc-Settling curves for various alum doses at influent turbidity 150 NTU | |||
| File figure12.JPG | 32 kB | user-27d2e | Feb 27, 2008 14:11 |
|
Tube Floc- Settling curves at various G's at 50 NTU at 10 ft | ||
| Version 1 (current) | 32 kB | user-27d2e | Feb 27, 2008 14:11 | Tube Floc- Settling curves at various G's at 50 NTU at 10 ft | |||
| File figure8.JPG | 32 kB | user-27d2e | Feb 27, 2008 14:09 |
|
Tube floc- same as figure 7 but 600 sec settle time | ||
| Version 1 (current) | 32 kB | user-27d2e | Feb 27, 2008 14:09 | Tube floc- same as figure 7 but 600 sec settle time |
Attachments
Overview
Content Tools