| Name | Size | Creator | Creation Date | Labels | Comment | ||
|---|---|---|---|---|---|---|---|
| JPEG File image016.jpg | 12 kB | user-dd1ec | Feb 04, 2008 00:41 |
|
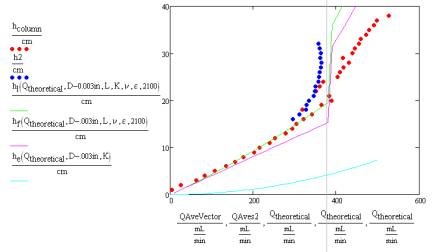
Q vs h through the turbulent transition. Red data was collected with the column set up before the bottom valve was installed/blue data was collected with the valve in. Theoretical values assume the tube ID was 0.003in less than manufacturer's specs (F07). | ||
| Version 1 (current) | 12 kB | user-dd1ec | Feb 04, 2008 00:41 | Q vs h through the turbulent transition. Red data was collected with the column set up before the bottom valve was installed/blue data was collected with the valve in. Theoretical values assume the tube ID was 0.003in less than manufacturer's specs (F07). | |||
| GIF File image018.gif | 10 kB | user-dd1ec | Feb 04, 2008 00:42 |
|
The change in water level in the FCM as a function of back pressure on the float valve inlet. | ||
| Version 1 (current) | 10 kB | user-dd1ec | Feb 04, 2008 00:42 | The change in water level in the FCM as a function of back pressure on the float valve inlet. | |||
| GIF File image017.gif | 10 kB | user-dd1ec | Feb 04, 2008 00:42 |
|
Graph of the change in water level in the FCM as pressure built up behind the float valve | ||
| Version 1 (current) | 10 kB | user-dd1ec | Feb 04, 2008 00:42 | Graph of the change in water level in the FCM as pressure built up behind the float valve | |||
| JPEG File image014.jpg | 9 kB | user-dd1ec | Feb 04, 2008 00:42 |
|
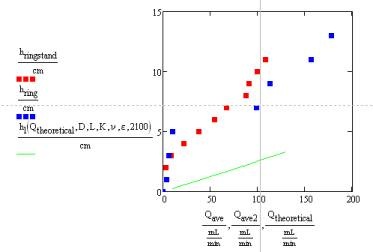
The first two data sets gathered in Fall 2007 in red and blue for the relationship between headloss and outflow. The theoretical values for flow rate and headloss are shown in green. | ||
| Version 1 (current) | 9 kB | user-dd1ec | Feb 04, 2008 00:42 | The first two data sets gathered in Fall 2007 in red and blue for the relationship between headloss and outflow. The theoretical values for flow rate and headloss are shown in green. | |||
| JPEG File image015.jpg | 9 kB | user-dd1ec | Feb 04, 2008 00:41 |
|
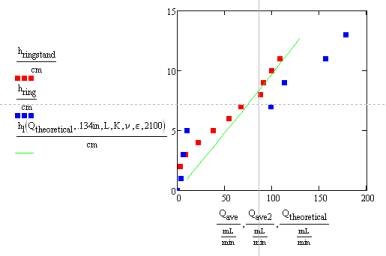
The first two data sets gathered in Fall 2007 in red and blue for the relationship between headloss and outflow. The theoretical values for flow rate and headloss adjusted for a tubing diameter of 0.134in are shown in green. | ||
| Version 1 (current) | 9 kB | user-dd1ec | Feb 04, 2008 00:41 | The first two data sets gathered in Fall 2007 in red and blue for the relationship between headloss and outflow. The theoretical values for flow rate and headloss adjusted for a tubing diameter of 0.134in are shown in green. |
Attachments
Overview
Content Tools