 Sign-up for free online course on ANSYS simulations!
...
To save a copy of the plot, click on Plot in the Export menu. Save the plot as sigma_xx.fig. To convert the plot to the jpeg format, open sigma_xx.fig in MATLAB: at the MATLAB prompt, type open('sigma_xx.fig'). A MATLAB quirk is that the colorbar is not automatically displayed in this window. (Without the colorbar, the reader cannot determine the stress levels corresponding to the various colors.) To add the colorbar to the plot, click on the Insert Colorbar button in the toolbar at the top (see snapshot below).
In the figure window, select File -> Save as. Under Save as type, select JPEG image and click Save. Open the jpeg image from your working folder to verify that it has been created properly.
Plot σ11
To plot the principal stress σ11, select Stress (11) i n the Plotting menu. You'll get an error saying "Reference to non-existent field 'principals'". This is because we have not yet calculated the principal stresses from the stress components. Go to the Post-Process menu and select Principals. You'll see the message Principals done. Try plotting Stress (11) now.
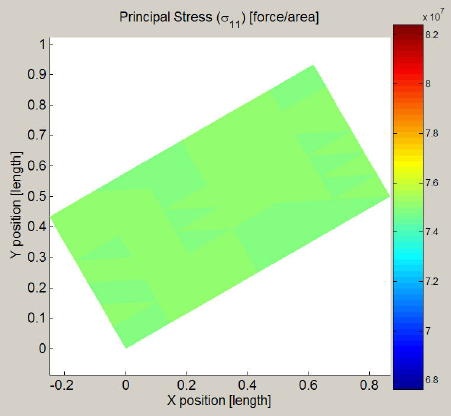
We again get a homogeneous state of stress as expected. From the colorbar, the stress value is around 75 MPa which matches the applies normal traction. Click on Plot in the Export menu and save the plot as sigma_11.fig.
Export Data
To save all the data in the workspace, select Workspace in the Export menu. Specify rect.mat as the filename and click OK.
...