 Sign-up for free online course on ANSYS simulations!
Problem Specification
1. Create Command Log file
2. Modify Log file - part1
3. Modify Log file - part2
4. Solve
5. Postprocess the results
...
Restart ANSYS or go to Utility Menu > File > Clear & Start New and select Do not read file.
Copy the list of commands and paste them in the ANSYS Command Input window. The list of commands will generate the following:
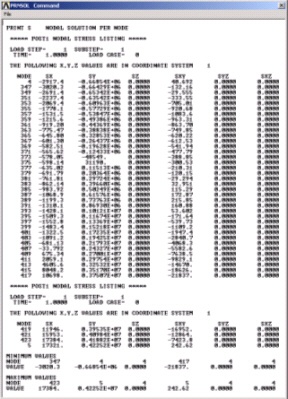
Analysis of Results
We will use the theoretical solution developed by Greszczuk, L.B (see reference below) to verify the results obtained with ANSYS. To do this, we need to import the results obtained into Excel or a similar application.
After the solution is performed, save the list generated (PRPATH command window). Go to File > Save as. Enter plate2.lis as the file name. Open this file using Excel or a similar application and delete all columns except the SY column (circumferential stress). You will need to create a new column to specify the angle. Recall that the angle at each node can be determined based on the number of divisions (90deg/40div=2.25 increments). The file will look like this:
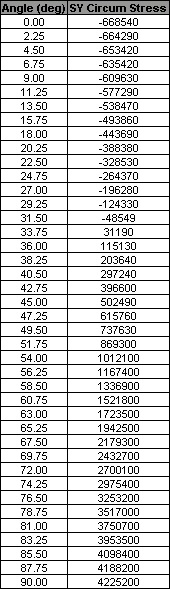
Create a text file (results.txt) with these results. Use Matlab or a similar application to import/read the results.txt file and plot them along with the theoretical solution. Refer to the reference below for a detailed description of the theoretical solution and associated equations.
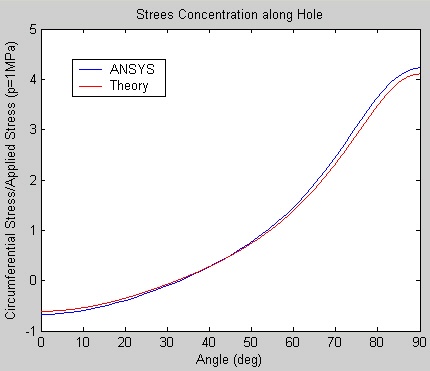
As we can see, the solution obtained with ANSYS compares well with the theoretical solution. The highest variation between the theoretical solution and the results obtained with ANSYS occurs at 90 deg. At this angle, the value obtained with ANSYS varies by less than 3% with respect to the theoretical value.
...