 Sign-up for free online course on ANSYS simulations!
...
Utility Menu > PlotCtrls > Pan,Zoom,Rotate > Right
(Click Picture for Larger Image)
...
Select Stress from the left list, Y-direction SY from the right list and click OK.
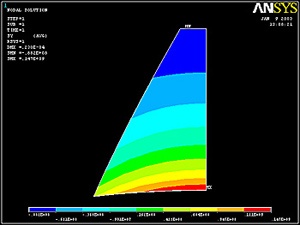
(Click Picture for Larger Image)
...
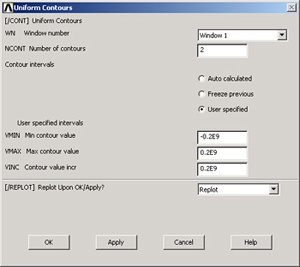
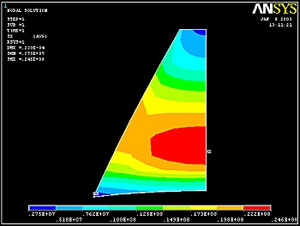
Enter 2 for Number of contours, and choose User specified for Contour Intervals. Enter Min contour value=-0.2E9, Max contour value=0.2E9, and Contour value incr=0.2E9. Click OK.
This plots the regions with positive and negative σθvalues in different colors. In the red region, 0<σθ<200MPa and in the blue region, -200MPa<σθ<0. So the boundary between the two colors is the neutral axis.
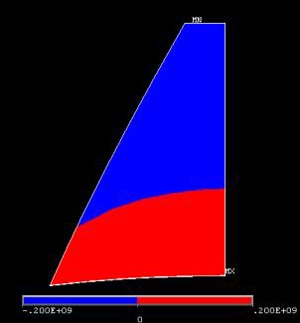
The FEA results indicate that the neutral axis is curved, contrary to the assumption in mechanics of materials theory.
...
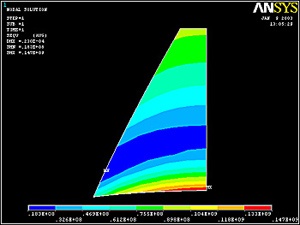
Enter 9 for Number of contours, and choose Auto calculated for Contour Intervals. Click OK.
(Click Picture for Larger Image)
...
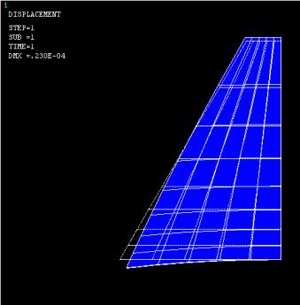
This plots the deformed and undeformed shapes in the Graphics window. The maximum displacement DMX=0.230e-4 m.
Animate the deformation:
Utility Menu > PlotCtrls > Animate > Deformed Shape
...
Save your work: Toolbar > SAVE_DB