 Sign-up for free online course on ANSYS simulations!
...
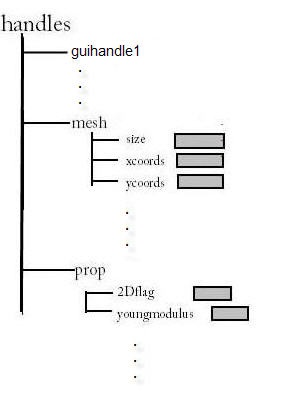
will give you a row vector containing the x-coordinates of all the nodes. You can visualize the handles structure as per the figure below.
Investigate the handles structure using the debugger
You can set use the debugger to investigate further what the fields of the handles structure look like. In the MATLAB editor, add a breakpoint in CalcStrainStress.m at the statement handles=guidata(fighandle). You can add a breakpoint by clicking to the left of the line. A red circle should appear as shown below.

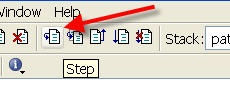
We'll run a problem in redAnTS in order to force the program to stop execution at this statement. Run through the first four steps of the Introductory redAnTS Tutorial. This can be accessed from within the redAnTS folder at: redAnTS_tutorial/redAnTS_tutorial.htm. Next, calculate σxxas per the first item in Step 5 of the tutorial. Program execution should stop at the above statement. Check the Workspace. Then, step through this statement using the step icon.
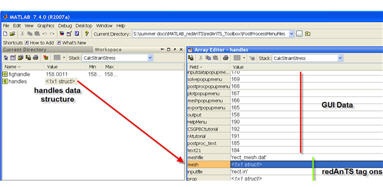
In the Workspace, you should see that handlesstructure has been created. Double-click on this variable to see what the fields of the structure look like. Reconcile what you see with the fields listed in the main redAnTS help page.
Type the following at the command line to see what the nodal x-coordinates are:
...
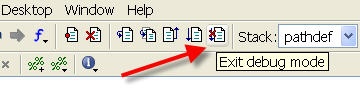
After you are done investigating the handles structure in the debugger, exit the debug mode by clicking on the Exit debug mode icon in the editor.
You should now have enough background to provide post-processing capabilities in redAnTS by modifying the following functions:
...